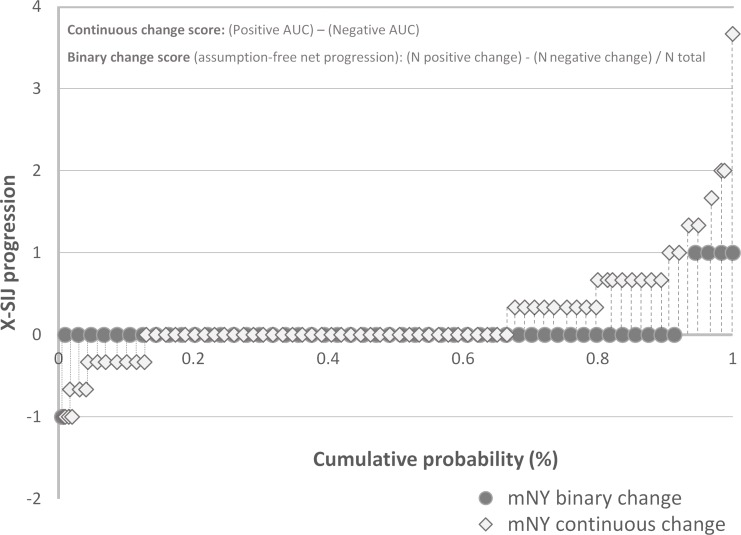
Figure 1.
Cumulative probability plot. Structural progression in radiographs of the sacroiliac joints (X-SIJ) according to the modified New York criteria (mNY), measured as binary change (possible values: +1, 0, −1) and continuous grade change (range of possible values: −8; 8). Each data point represents either binary (black circles) or continuous (open diamonds) progression from one unique patient (selection from the total sample to increase readability but covering the full range of observed values). Positive AUC: dashed lines; negative AUC: dotted lines. AUC, area under the curve; N, number of patients.

