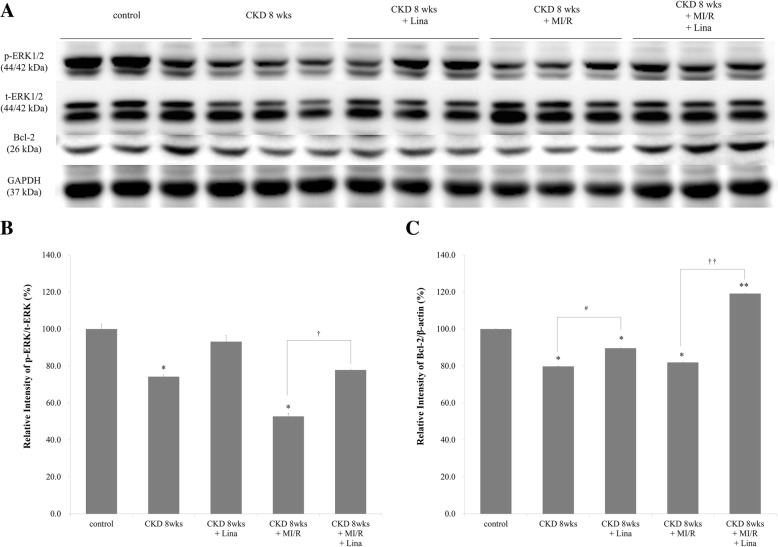
Fig. 11.
Phosphorylation of EKR1/2 and expression of Bcl-2 in the myocardium. a Western blot showing protein levels in control, CKD with/without linagliptin, and CKD-MI with/without linagliptin rats. b and c Quantitation of p-ERK1/2 and Bcl-2 standardized relative to t-ERK1/2, and GAPDH expression in the renal cortex. *p < 0.05 vs. control; #p < 0.05 vs. CKD, 8 weeks; †p < 0.05 vs. CKD, 8 weeks + MI/R; ††p < 0.01 vs. CKD, 8 weeks + MI/R

