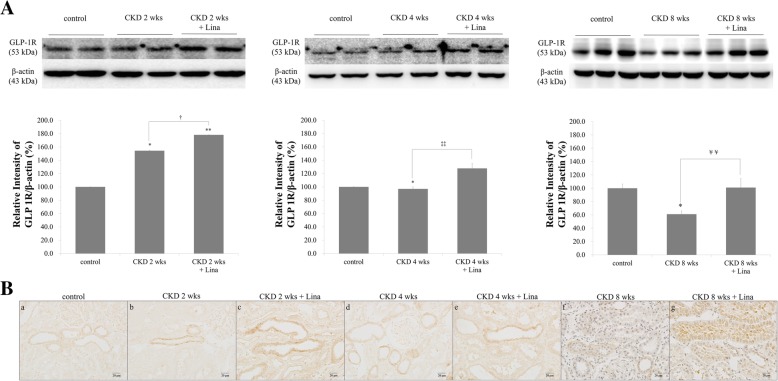
Fig. 6.
Effect of linagliptin in CKD and CKD with linagliptin-treated rats. A Western blot analysis of CKD and CKD with linagliptin-treated rats. B GLP-1R immunoreactivity in the renal cortical proximal tubule of CKD and CKD with linagliptin-treated rats. a, control; b, CKD, 2 wks; c, CKD, 2 weeks with linagliptin-treated; d, CKD, 4 wks; e, CKD, 4 weeks with linagliptin-treated; f, CKD, 8 wks; g, CKD, 8 weeks with linagliptin-treated; Values are presented as the mean ± SD. *p < 0.05 vs. control; **p < 0.01 vs. control; †p < 0.05 vs. CKD, 2 weeks; ††p < 0.01 vs. CKD, 2 weeks; ‡p < 0.05 vs. CKD, 4 weeks; ‡‡p < 0.01 vs. CKD, 4 weeks; ¥p < 0.05 vs. CKD 8, weeks; and ¥¥p < 0.01 vs. CKD, 8 weeks. Magnification 400 ×

