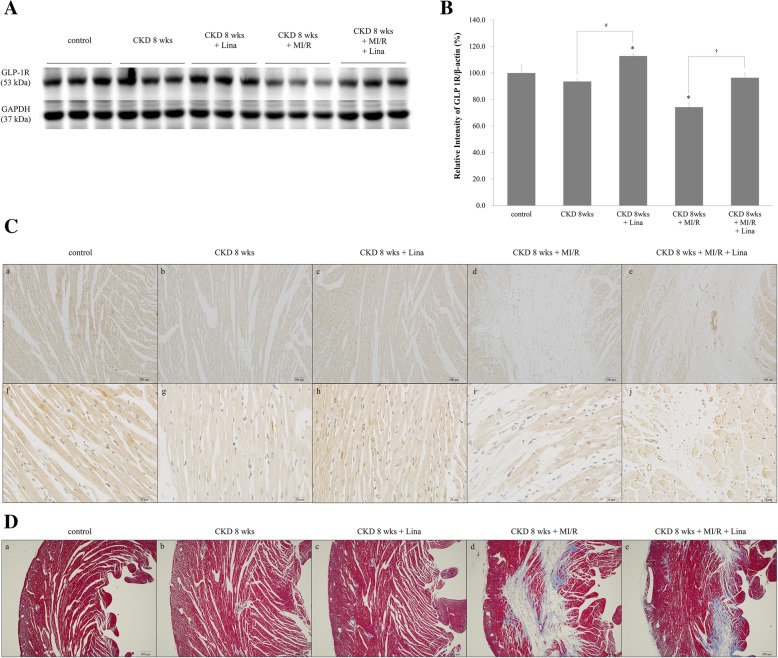
Fig. 9.
Expression of myocardial GLP-1R. A Western blot analysis of protein levels in the myocardium of control; CKD, 8 weeks; CKD, 8 weeks + Lina; CKD, 8 weeks + MI/R; and CKD, 8 weeks + MI/R + Lina rats. B Quantification of GLP-1R protein levels was standardized based on glyceraldehyde 3-phosphate dehydrogenase (GAPDH) expression in the myocardium. C GLP-1R immunoreactivity of myocardium. a and f, control; b and g, CKD, 8 weeks; c and h, CKD, 8 weeks with linagliptin-treated; d and i, CKD, 8 weeks and MI/R; e and j, CKD, 8 weeks and MI/R with linagliptin-treated group. D Masson’s Trichrome staning of myocardium. a, control; b, CKD, 8 weeks; c, CKD, 8 weeks with linagliptin-treated; d, CKD, 8 weeks and MI/R; e, CKD, 8 weeks and MI/R with linagliptin-treated group. CKD, chronic kidney disease; MI/R, myocardial ischemia/reperfusion; Lina, linagliptin. Values are presented as the mean ± SD. *p < 0.05 vs. control. B a–e, magnification 100×; f–o, magnification 400×, C a–e, magnification 100 ×

