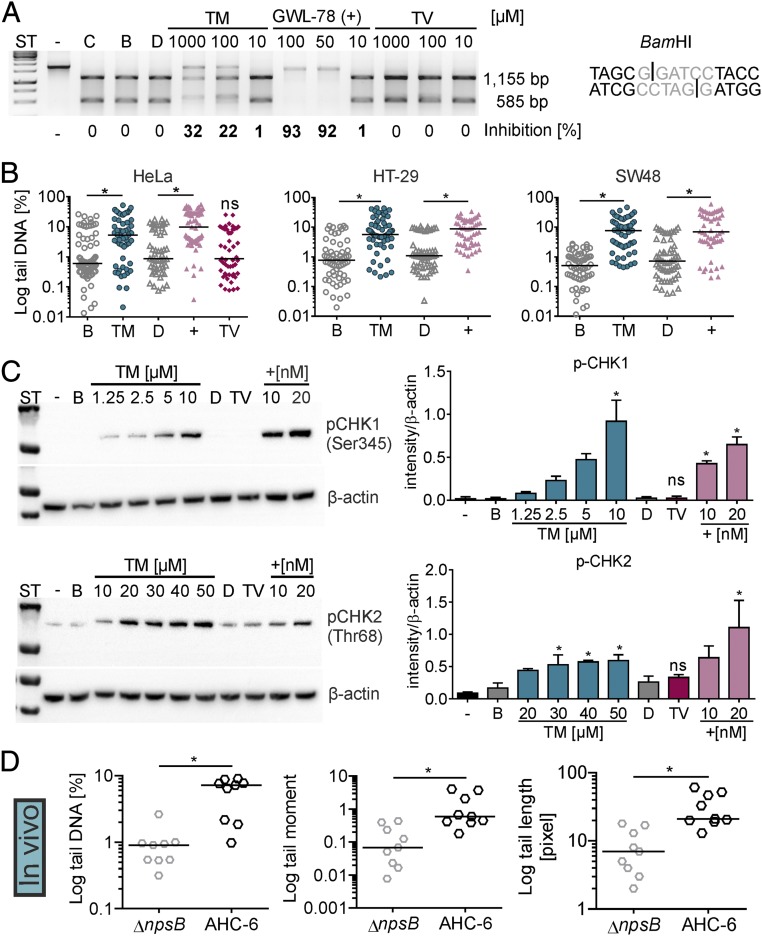
Fig. 3.
TM interacts with DNA and induces cellular DNA damage in vitro and in vivo. (A) DNA substrate with a BamHI site (Right) was incubated with buffer (C), solvents n-butanol (B) or DMSO (D), different concentrations of TM and TV, or the positive control GWL-78 (+). Nuclease activity on treated DNA compared with solvent and uncut control (−) was visualized by electrophoresis. Percent inhibition is shown. (B) Tail DNA (in percentage) for comet of HeLa treated 4 h with 10 µM TM, 10 µM GWL-78 (+), 20 µM TV, or solvents. HT-29 and SW48 cells were treated with 1 mM TM or controls. Bars represent medians of each dataset (n ≥ 50 cells). Kruskal–Wallis test followed by Dunn’s multiple comparison (*P ≤ 0.05). (C) Phosphorylated (p)-CHK1 in lysates of HT-29 cells treated 4 h with increasing concentrations of TM, GWL-78 (+), 20 µM TV, or solvents. p-CHK2 detected in HT-29 lysates after 8-h treatment (Left). Means ± SEM of p-CHK1/2 signals obtained from three independent cell lysates normalized to β-actin are shown (Right). One-way ANOVA followed by Sidak’s multiple comparison (*P ≤ 0.05) (ns = not significant). (D) Comet of cecal enterocytes of infected mice (24 h) showed tail DNA, tail length, and tail moment were significantly different when mice were colonized with K. oxytoca AHC-6 (WT) compared with the ∆npsB-mutant. Bars represent medians of each dataset (n = 9 mice, with ≥50 cells per mouse), and significance was determined with Mann–Whitney test (*P ≤ 0.05).

