Fig. 5.
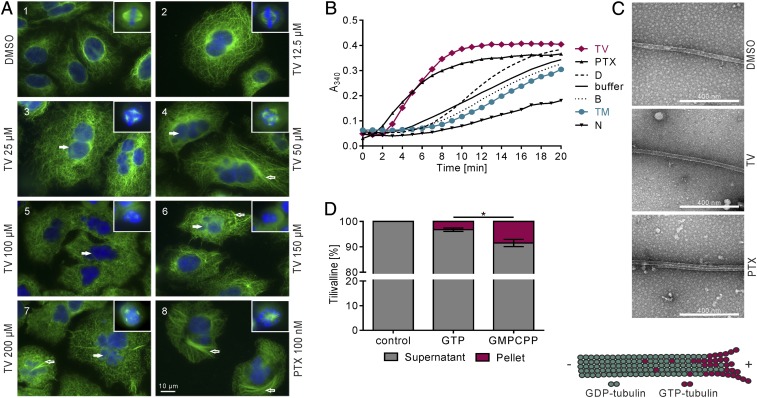
TV targets tubulin. (A) A549 cells were treated with DMSO, increasing doses of TV and PTX for 24 h. DNA was visualized with Hoechst 33342 (blue) and α-tubulin with antibody (green). Insets are mitotic spindles from the same preparation. (B) Tubulin polymerization in the presence of effectors TV (100 µM), PTX (10 µM), TM (10 µM), and nocodazole (N) (10 µM) was monitored via A340 over time. Shown are means (n = 4). (C) Electron micrographs confirm that turbidity reflects microtubule formation in reactions with DMSO, TV (75 µM), and PTX (10 µM). (D) TV present in polymers or supernatant was analyzed via HPLC-UV/VIS. Bars indicate distribution of TV following reactions without or with tubulin plus nucleotide. Shown are means ± SEM (n = 3), and significance was determined with one-way ANOVA followed by a Bonferroni post hoc test (*P ≤ 0.05).

