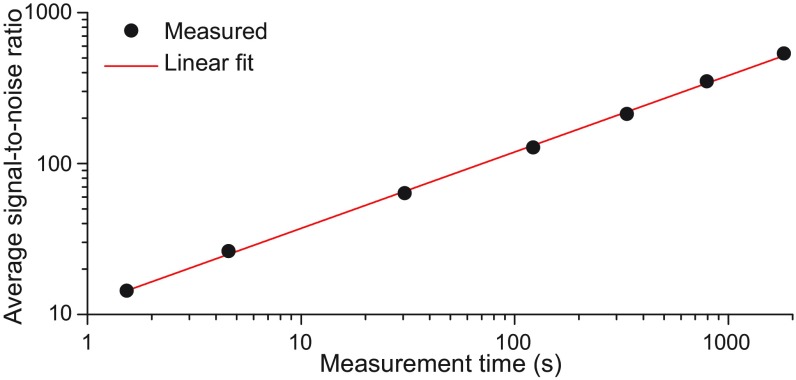
Fig. 4.
Evolution of the average signal-to-noise ratio with the measurement time in an ethylene spectrum. The fit of a line to the experimental data shows a slope of 0.506 (5) indicating that the signal-to-noise ratio shows dependence with the square root of the measurement time. The spectrum corresponding to a measurement time of 1,742 s is shown in Figs. 2 and 3.

