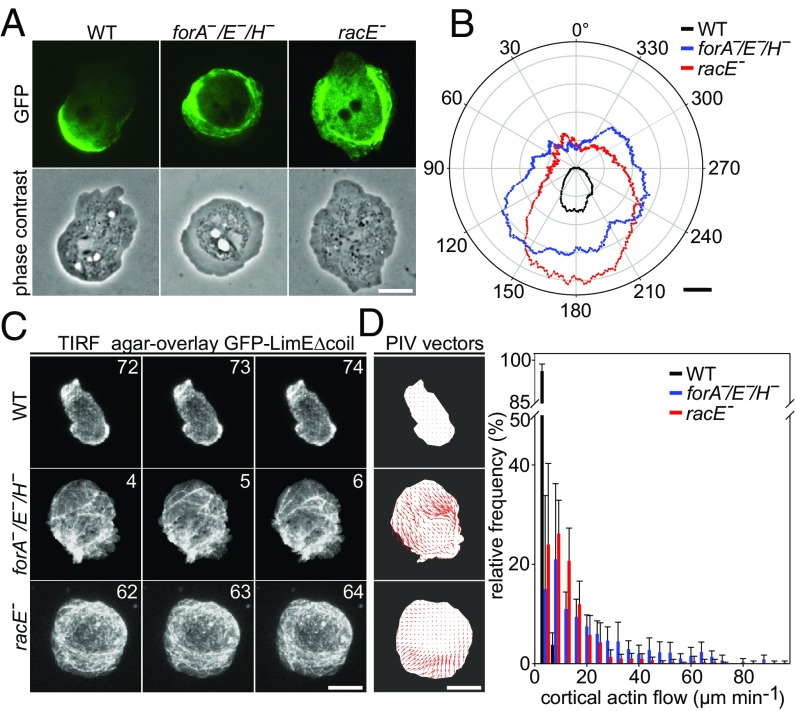
Fig. 7.
ForA−/E−/H− and racE− mutants cannot polarize and exhibit a drastically increased cortical flow in 2D-confinement. (A) The characteristic localization of GFP-myosin II in the rear cortex of WT cells is abolished in forA−/E−/H− and racE− mutant cells illustrating a major defect in polarization. Still images from time-lapse movies correspond to Movie S9. (Scale bar, 10 µm.) (B) Quantification of the width of the cortical myosin layer in WT and mutant cells determined by rotational analysis of the fluorescence signal from cells as shown in A. Radar plot shows the mean myosin II band thickness of the cell lines indicated. (Scale bar, 0.5 µm.) (C) Still images from TIRF time-lapse movies of WT and mutant cells expressing the F-actin probe GFP-LimEΔcoil in 2D-confined conditions under agar. Time is in seconds. (Scale bar, 10 µm.) (D) PIV analyses of cortical actin flow in WT and mutant cells. Five consecutive frames recorded at 0.5-s intervals corresponding to Movie S10 were used for PIV analysis. The resulting vectors mark the mean actin velocity per frame (Left). Distribution of actin flow velocities of the cell lines reveal a strikingly increased actin flow in the mutants (Right). Error bars are standard error of the mean.

