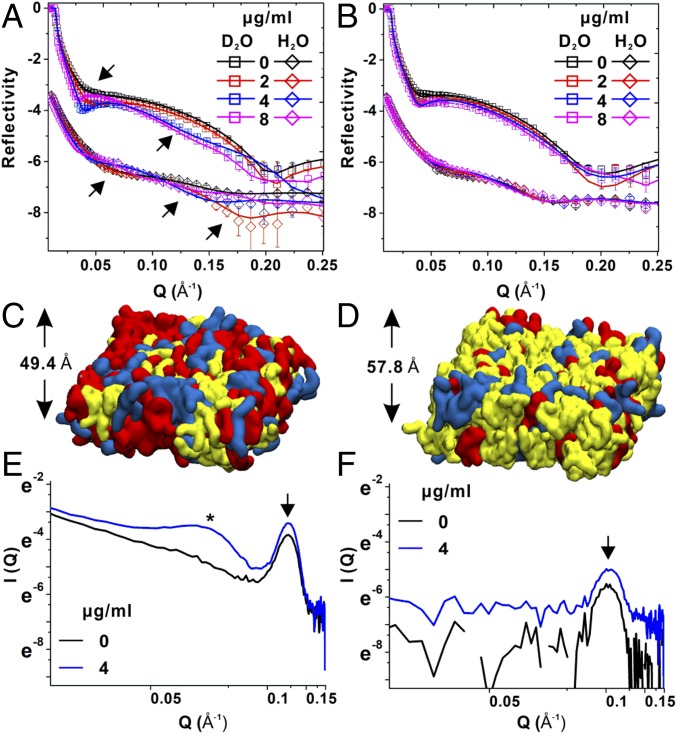
Fig. 3.
Daptomycin–membrane interactions. The neutron reflectivity profiles (symbols) and fits (lines) of (A) A8819 and (B) A8819Cls2T33N membrane models in D2O and H2O are shown. The NR profiles in H2O are offset for clarity. The arrows indicate fringe shifts of NR profiles. The molecular models of reconstituted (C) A8819 and (D) A8819Cls2T33N membranes show a thicker but more CL-rich membrane structure (with CL in yellow, PG in red, and L-PG in blue). Small-angle neutron scattering profiles measured for (E) A8819 and (F) A8819Cls2T33N membranes treated with and without daptomycin (4 μg/mL). The arrow indicates the lipid bilayer, whereas the star indicates the Bragg peak as the sign of micelle formation.

