Fig. 2.
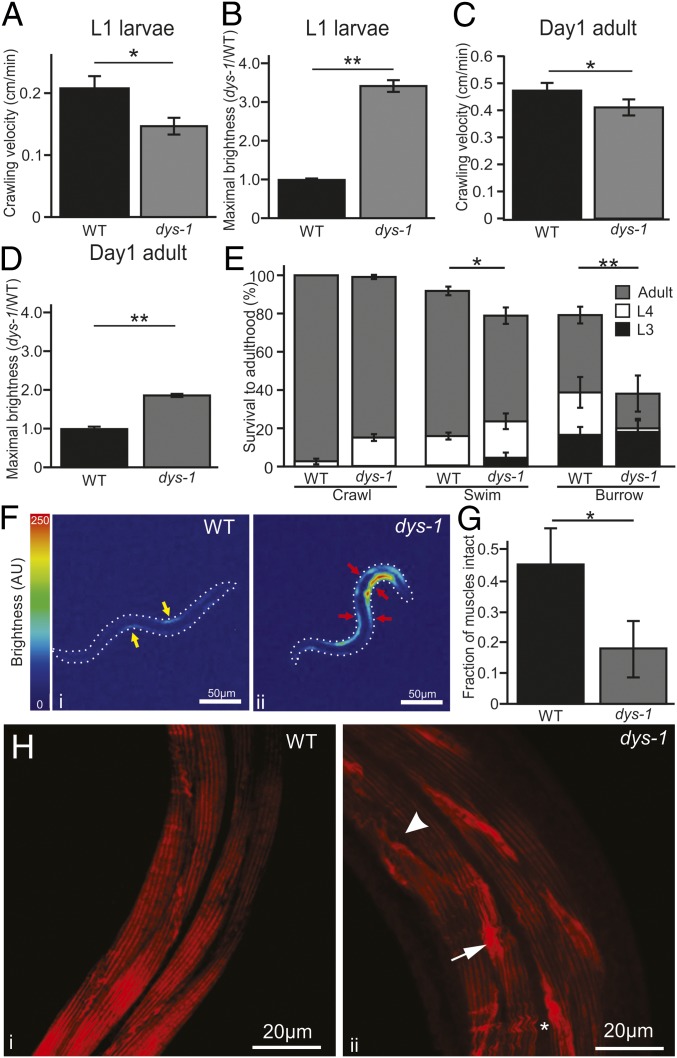
Dystrophic C. elegans displays motor and physiological deficits early in development. (A) Recently hatched dystrophic L1 larvae have reduced crawling velocity compared with WT larvae. (B) Muscular cytosolic calcium concentration was measured indirectly through GCaMP2 expression in body-wall musculature (driven by the promoter for myosin heavy chain A, Pmyo-3). Young dystrophic larvae (L1) were more than three times brighter than WT. Peak (whole animal) brightness normalized to WT is reported. After burrowing to adulthood for 3 d, dystrophic adult animals were still impaired in locomotion (C) and increased cytosolic calcium levels (D). (E) Compared with WT, burrowing dys-1 larvae showed increased mortality and developmental delays, with roughly half of surviving animals reaching adulthood after 3 d. (F) Heat maps showing the relative GCaMP2 brightness of WT (i) and dystrophic L1 (ii) larvae. AU, arbitrary unit. WT animals had low amplitude signals in the contracting musculature and no detectable signal in relaxed muscles (yellow arrows). Dystrophic larvae displayed brighter GCaMP2 signals, including concomitant activation of antagonistic muscles (red arrows). (G) After burrowing to adulthood, less than 20% of dystrophic muscle showed no sign of damage (visualized through phalloidin staining of F-actin) and remained healthy, whereas this count was above 40% in burrowing WT animals. (H) Dystrophic animals that survived burrowing to adulthood (ii) had signs of muscular degeneration compared with WT animals (i), including actin accumulation (arrow), discontinuation of fibers (arrowhead), and wavy muscle fibers (asterisk). **P < 0.001, *P < 0.05.

