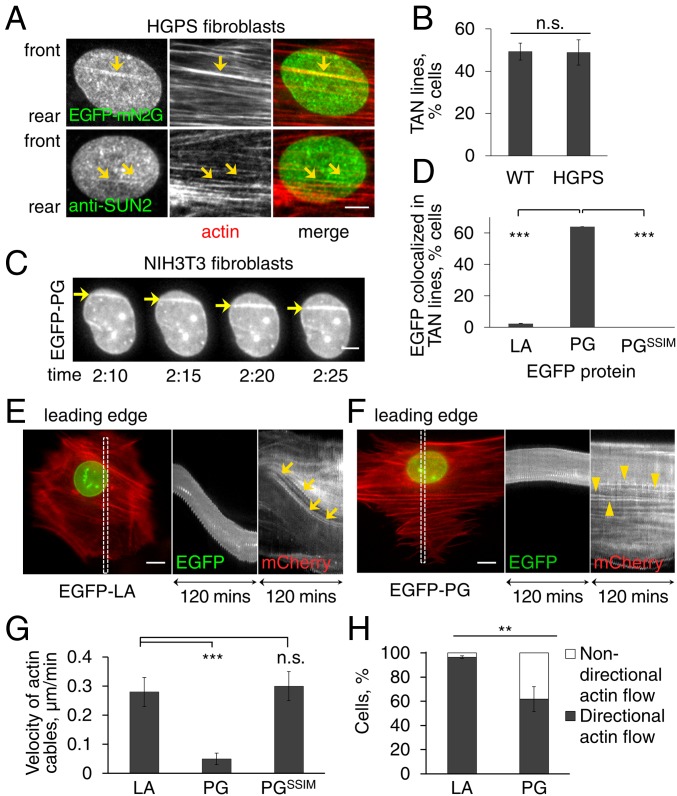
Fig. 3.
Progerin expression affects TAN line anchorage to the nuclear envelope and retrograde actin flow. (A) Representative images of a nucleus in an LPA-stimulated HGPS fibroblast expressing EGFP-mN2G (Top) or stained for SUN2 (Bottom). mN2G and SUN2 formed linear structures (arrows) that colocalized with actin filaments (stained by phalloidin) indicating TAN line formation. (B) Quantification of TAN line formation in control (WT) and HGPS fibroblasts (n = 3 experiments; n > 70 cells). (C) Images from a movie (Movie S1) of EGFP-progerin in NIH 3T3 fibroblasts. Note accumulation of EGFP-progerin in TAN lines (arrows) that slip over an immobile nucleus. (See Movie S1 for mCherry-LifeAct signal.) Time, h:min after LPA treatment. (D) Quantification of cells in which the indicated EGFP-tagged proteins (LA, lamin A; PG, progerin) colocalized with TAN lines (n = 3 experiments; n > 50 cells). (E and F) Representative kymographs from movies of LPA-stimulated NIH 3T3 fibroblasts expressing EGFP-lamin A (LA) (E, from Movie S2) or EGFP-progerin (PG) (F, from Movie S3) together with mCherry-LifeAct. The color image is the first frame of the movies (30 min after LPA stimulation) and shows the region (box) used for the kymographs on the Right. Note slower rearward actin flow in cells expressing EGFP-progerin (arrowheads) compared with EGFP-lamin A (arrows). Leading edge of the cells is toward the top in all panels. (G) Quantification of the velocity of retrograde actin flow near the leading edge in NIH 3T3 fibroblasts expressing mCherry-LifeAct and the indicated EGFP-tagged proteins (LA, lamin A; PG, progerin) (n = 3 experiments, n > 40 actin cables). (H) Quantification of the directionality of actin flow in NIH 3T3 fibroblasts expressing mCherry-LifeAct and indicated EGFP-tagged proteins (LA, lamin A; PG, progerin) (n = 3 experiments; n > 50 cells). Data are mean ± SEM from ≥3 experiments. n.s., P > 0.05; **P < 0.01; ***P < 0.001 by t test. (Scale bars, A and C: 5 µm; E and F: 10 µm.)

