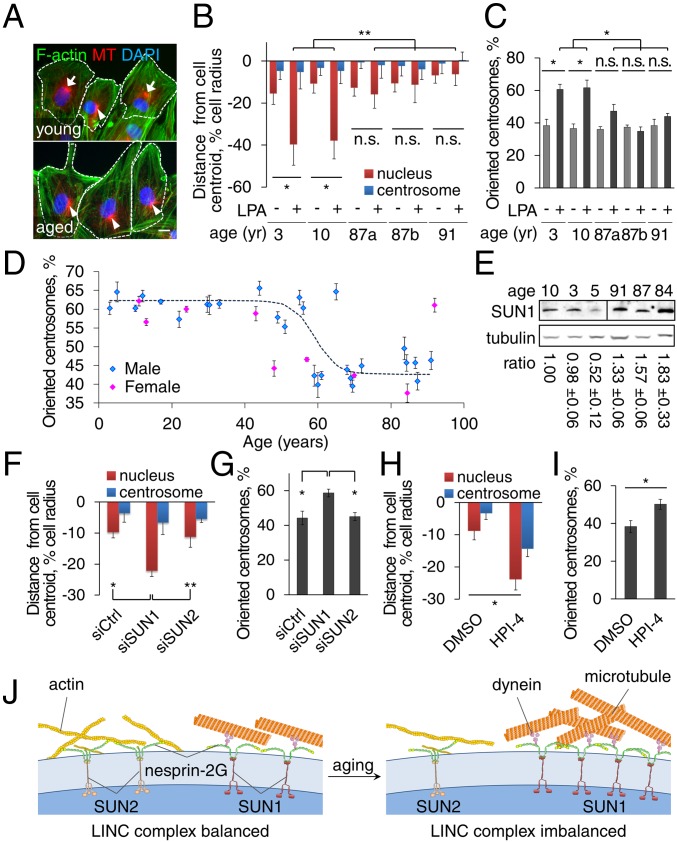
Fig. 6.
Fibroblasts from aged individuals exhibit cell polarity defects that are ameliorated by SUN1 knockdown and dynein inhibitor. (A) Representative images of F-actin, microtubules (MT), and nuclei (DAPI) in LPA-stimulated fibroblasts from young (10 y) and aged (87 y) male individuals. Arrows: oriented centrosomes; arrowheads: unoriented centrosomes; dashed lines: cell borders. (Scale bar, 10 µm.) (B and C) Quantification of nuclear and centrosomal positions (B) and centrosome orientation (C) in LPA-stimulated fibroblasts from young and aged male individuals (87a and 87b are different individuals). (D) Quantification of centrosome orientation after LPA stimulation of fibroblasts from males (blue) and females (pink) of different ages. The trend line is a logistic regression curve fitted to the results for male fibroblasts (P < 0.0001, Pearson’s χ2 test). (E) Immunoblots of SUN1 and tubulin in fibroblasts from young and aged individuals. The SUN1/tubulin ratio is mean ± SEM from three experiments and is normalized to the leftmost sample (P < 0.05 by t test, young versus aged cells). (F and G) Quantification of nuclear and centrosomal positions (F) and centrosome orientation (G) in LPA-stimulated fibroblasts (87 y) treated with indicated siRNAs. (H and I) Quantification of nuclear and centrosome positions (H) and centrosome orientation (I) in LPA-stimulated aged (87 y) fibroblasts treated with vehicle (DMSO) or 5 µM HPI-4 for 1 h. Data are mean ± SEM from ≥ 3 experiments (n > 90 cells). n.s., P > 0.05; *P < 0.05; **P < 0.01 by t test. (J) Model for the imbalanced engagement of the nucleus with the cytoskeleton in fibroblasts from HGPS and aged individuals.

