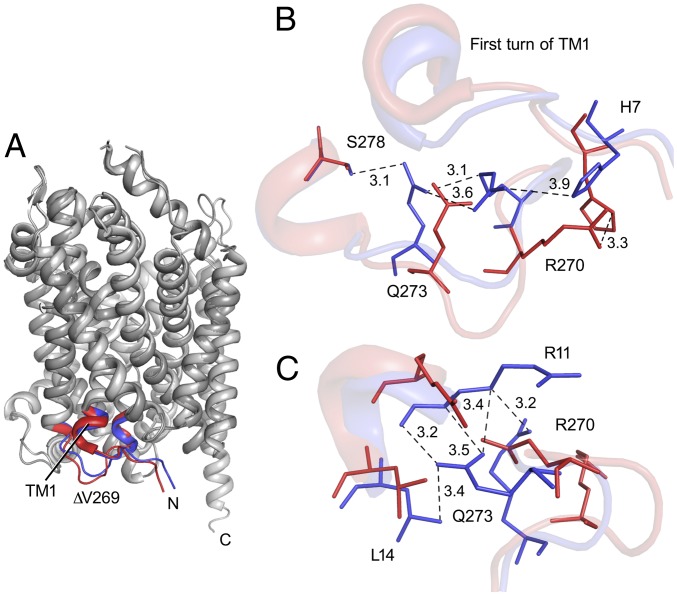
Fig. 2.
Structure of LeuT ∆V269. (A) Superposition of LeuT ∆V269 with PDB ID code 2A65. The primary differences in the intracellular region are highlighted in red (PDB ID code 2A65) and blue (∆V269). (B) Reorientation of the residues immediately following the ∆V269 is displayed. The movement of the first helical turn of the TM1 region is displayed in cartoon representation in the background. (C) Residues responsible for movements in the first turn of TM1 are highlighted (also SI Appendix, Fig. S2).

