Fig. 5.
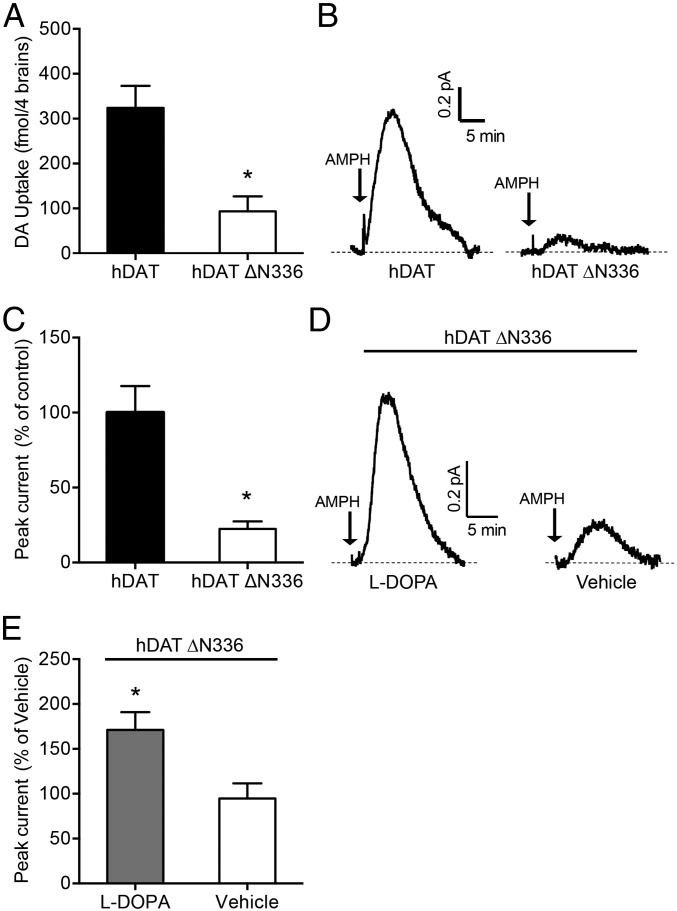
In Drosophila brain, hDAT ∆N336 cells display reduced DA uptake and AMPH-induced efflux. (A) Flies expressing hDAT ∆N336 display reduced DA uptake compared with hDAT-expressing brains. Data are represented as DA uptake (200 nM DA) using four Drosophila brains per well ± SEM (*P ≤ 0.01 by t test; n = 4). (B) Representative AMPH-induced (20 μM) amperometric currents recorded from fly brains expressing hDAT or hDAT ∆N336. Arrows indicate application of AMPH. (C) Quantitation of DA efflux. Data are presented as the peak amperometric current ± SEM (*P ≤ 0.01 by t test; n = 4). (D) Flies expressing hDAT ∆N336, when fed an l-DOPA (5 mM) diet for 24 h, display increased DA efflux compared with vehicle-fed flies. Representative AMPH-induced (20 μM) amperometric currents recorded from hDAT ∆N336 fly brains. Arrows indicate application of AMPH. (E) Quantitation of DA efflux. Data are presented as the peak amperometric current ± SEM (*P ≤ 0.05 by t test; n = 4).

