Fig. 6.
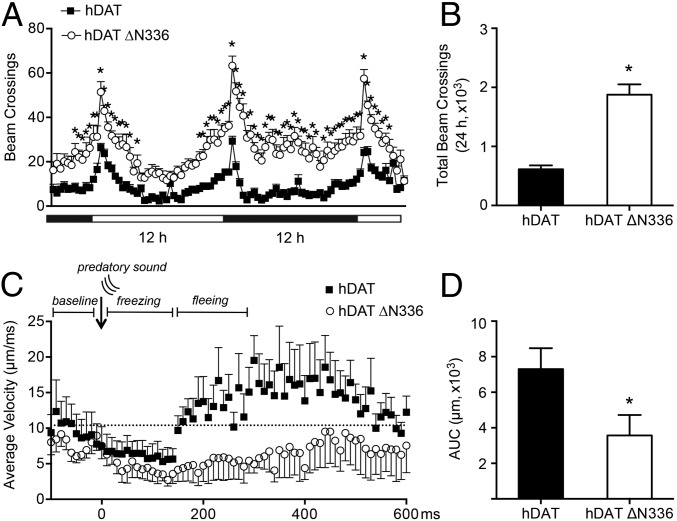
hDAT ∆N336 flies are hyperactive and show prolonged freezing and reduced fleeing. (A) Locomotor activity was assayed over 30 h during the light (horizontal white bars) and dark (horizontal dark bars) cycle. Flies expressing hDAT ∆N336 (○) were hyperactive compared with flies expressing hDAT (■) (*P < 0.05 by two-way ANOVA with Sidak’s post hoc test; n = 31–32). Beam crossings were binned into 20-min intervals. (B) Quantitation of total beam crossings over 24 h. Data are presented as the total beam crossing ± SEM (*P ≤ 0.0001 by Mann–Whitney test; n = 30–31). (C) Average velocity (μm⋅ms−1) was assayed over 600 ms following an auditory stimulus for flies expressing hDAT (■) or hDAT ∆N336 (○). The hashed line indicates preaudible baseline velocity. (D) AUC is calculated as the cumulative velocity from the onset to the end of the predatory sound. Quantitation of AUC over 600 ms for hDAT and hDAT ∆N336 flies. Data are presented as the total AUC ± SEM (*P ≤ 0.05 by t test; n = 8).

