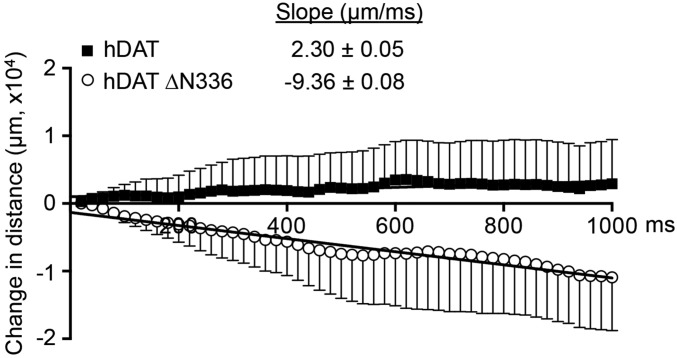
Fig. 7.
hDAT ∆N336 flies show social impairments as measured by proximity to their neighbors during the escape response. The sum of distances (μm) across four flies (social space) was calculated and assayed over 1,000 ms and normalized to the respective social space calculated at time 0. Over time, hDAT flies (■) display increased flock size, as determined by the slope of the fitting of the sum of distances over time (black dotted line: 2.30 ± 0.05 μm⋅ms−1). In contrast, hDAT ∆N336 flies (○) reveal decreased flock size over time (gray dotted line: −9.36 ± 0.08 μm⋅ms−1).

