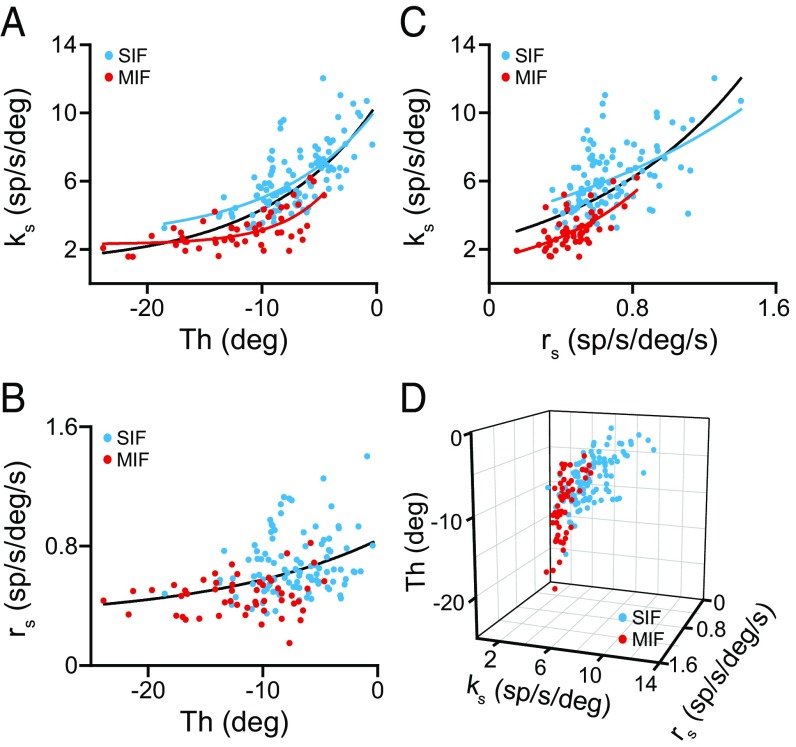
Fig. 4.
Relationships of SIF and MIF eye-related sensitivities with recruitment threshold during spontaneous eye movements. (A) Plots of eye position sensitivity (ks) versus threshold (Th) for 104 SIF (blue) and 51 MIF (red) motoneurons and for the whole population (SIF + MIF) of motoneurons (black line). Lines are the exponential regressions y = 2.587 + 7.642·e0.114x (r = 0.671, P < 0.001), y = 2.302 + 8.838·e0.235x (r = 0.660, P < 0.001), and y = 0.998 + 9.491·e0.104x (r = 0.754, P < 0.001) for SIF, MIF, and all motoneurons, respectively. (B) Same as A, but for eye velocity sensitivity (rs). A significant regression was obtained only when all of the motoneurons were grouped together (black line; y = 0.306 + 0.534·e0.069x; r = 0.402, P < 0.001). (C) Exponential regressions between eye position (ks) and eye velocity (rs) sensitivities for 104 SIF (blue; y = 3.774·e0.708; r = 0.498, P < 0.001), 51 MIF (red; y = 1.411·e1.642x; r = 0.619, P < 0.001) and for the entire population of motoneurons (black line; y = 2.587·e1.094x; r = 0.628, P < 0.001). (D) Scatterplot of ks, rs, and threshold for SIF (n = 104, blue dots) and MIF (n = 51, red dots) motoneurons.

