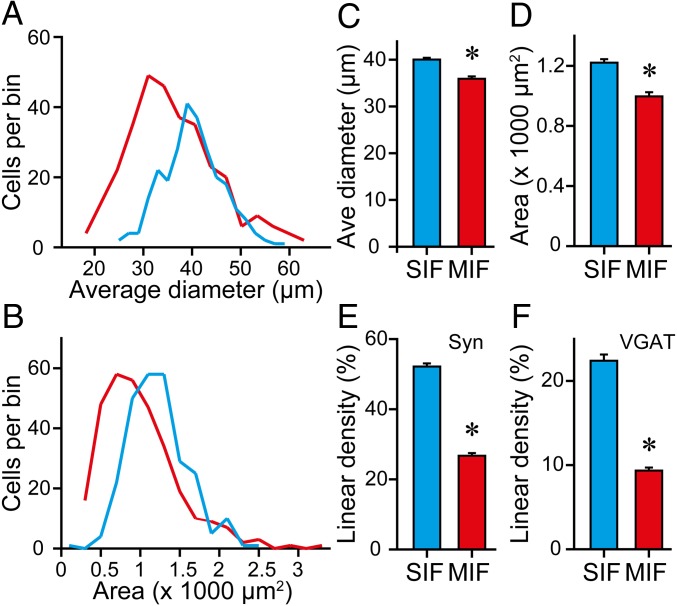
Fig. 8.
Morphological features of SIF and MIF motoneurons. (A and B) Frequency distribution of average diameters (A) and somatic areas (B) of SIF (blue lines) and MIF (red lines) motoneurons. (C) Histogram of the average (Ave) diameter of SIF and MIF motoneurons. (D) Same as C but for cell body area (for C and D, n = 264 and 311 SIF and MIF motoneurons, respectively; *P < 0.001, t test). (E) Bar chart showing the synaptic coverage, calculated as the percent of cell body perimeter surrounded by synaptophysin (Syn)-immunoreactive boutons, in SIF and MIF motoneurons (n = 144 and 153 SIF and MIF motoneurons, respectively; *P < 0.001, t test). (F) Same as E but for VGAT synaptic coverage (n = 120 and 158 SIF and MIF motoneurons, respectively; *P < 0.001, t test).

