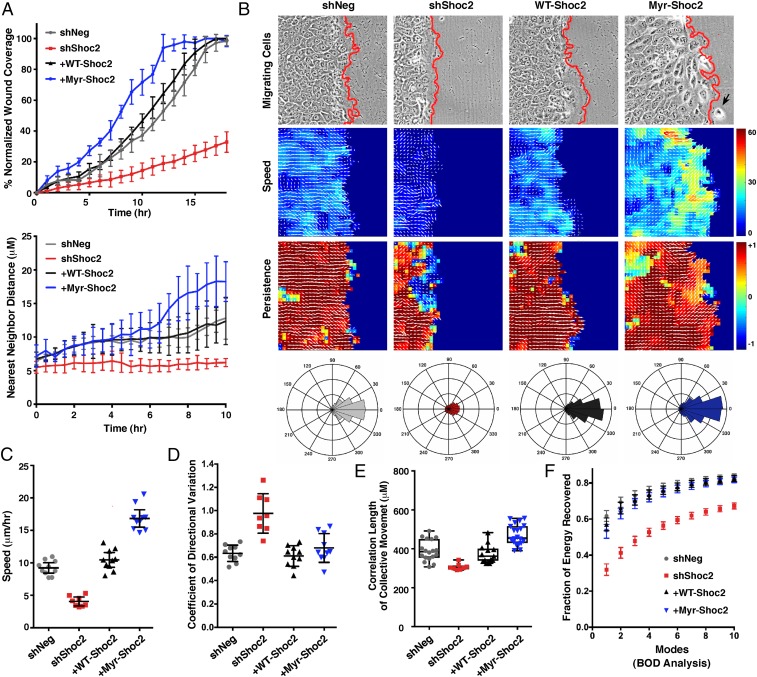
Fig. 4.
Computational analysis of Shoc2 function in collective cell migration. (A–F) Wound-healing and cell-scattering assays were conducted using cells stably expressing shNeg, shShoc2, or shShoc2 reexpressing either Pyo-WT-Shoc2 or Pyo-Myr-Shoc2. (A) Percent normalized wound coverage and nearest neighbor scatter distances were determined from images taken at 1-h and 30-min intervals, respectively. (B) PIV analysis was conducted to determine the velocity fields underlying cell motions captured by time-lapse movies (Top) of wound healing. Speed of cell migration (Middle) and persistence of cell movement in a given direction (Bottom) are depicted with a heat map, and directionality is indicated with white arrows. A black arrow points to a Myr-Shoc2–expressing cell that has escaped from the leading edge. Red lines indicate the leading edge border. Rose plots are also shown depicting the aggregate directionality distributions compiled over all times and space for each cell condition. (C) Speed distributions were determined over all times and space of wound healing, and shown is the mean average speed for each cell condition. (D) Variation in the directionality of motion was quantified and represented as the mean coefficient of directional variation. (E) Spatial velocity correlation analysis was used to determine the length of coordinated cell movement. (F) Biorthogonal decomposition (BOD) analysis was used to assess cohesiveness of the monolayer during sheet movement. Analysis reveals the number of connected components (“modes”) needed to cover the monolayer.

