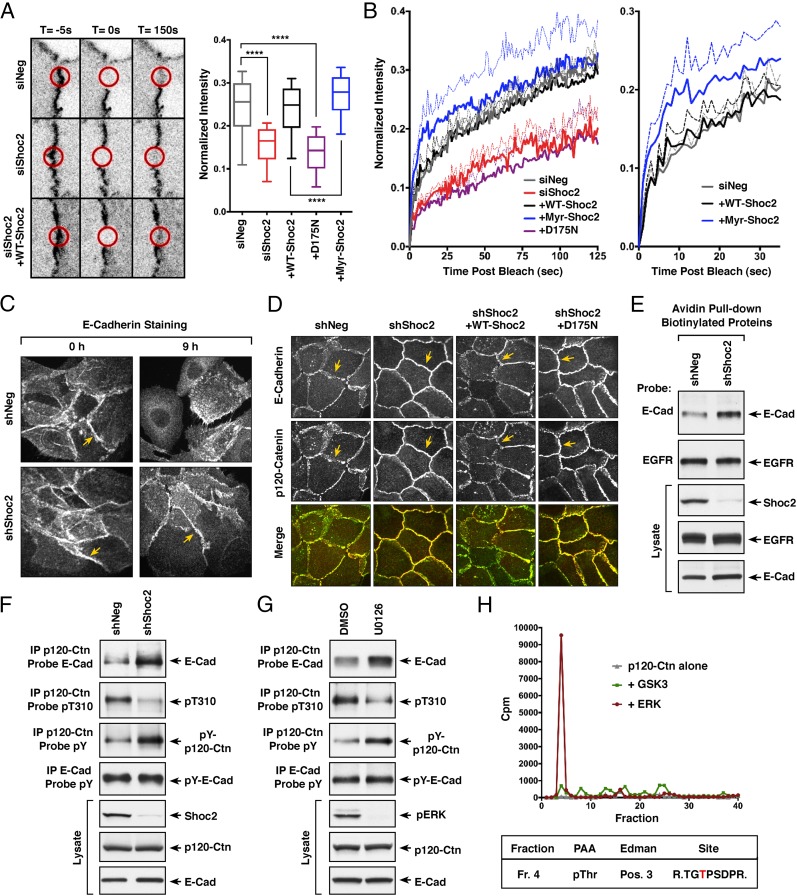
Fig. 5.
M-Ras/Shoc2 signaling modulates cell–cell adhesion through effects on E-cadherin turnover. (A) MCF10A cells stably expressing GFP-α-catenin alone or coexpressing GFP-α-catenin and the indicated Shoc2 proteins were transfected with control or Shoc2 siRNAs before junction analysis. Circular regions of interest (ROIs, indicated by red circles) at the cell–cell junctions were photobleached, and the recovery of GFP-α-catenin into the bleached areas was quantified and compared using exponential functions representing the fast and slow phases of recovery. (Error bars represent mean ± SD, ****P > 0.0001). (B) For each of the lines, mean fluorescence recovery over time is indicated as a solid line, with SEM depicted as dotted lines. (C) MCF10A cells stably expressing control shNeg or shShoc2 vectors were analyzed for E-cadherin localization during cell scattering. Shown are images taken at 0 and 9 h after scatter induction. (D) Confluent monolayers of MCF10A cells stably expressing shNeg or shShoc2 vectors were analyzed for E-cadherin and p120-catenin localization. Also analyzed were shShoc2-cells reexpressing WT- or D175N-Shoc2 proteins. Yellow arrows in C and D indicate cell–cell junctions. (E) Proteins on the surface of MCF10A cells stably expressing shNeg or shShoc2 vectors were biotinylated before cell lysis. The biotinylated surface proteins were then isolated using avidin-coupled beads, following which the beads were analyzed for the presence of EGFR and E-cadherin. Lysates were also monitored for EGFR, E-cadherin, and Shoc2 levels. (F) Endogenous p120-catenin or E-cadherin was immunoprecipitated from lysates of MCF10A cells stably expressing shNeg or shShoc2 vectors. p120-catenin immunoprecipitates were probed for E-cadherin, phosphotyrosine (pY), or pT310 levels, and E-cadherin immunoprecipitates were probed for pY levels. Total Shoc2, E-cadherin, and p120-catenin levels are also shown. (G) MCF10A cells treated for 18 h with DMSO or U0126 were analyzed as in F. (H) Purified p120-catenin was incubated with purified active ERK or GSK3 in the presence of γ[32P]-ATP, following which the p120-catenin protein was isolated and digested with trypsin. The resulting tryptic phosphopeptides were separated by reversed phase HPLC (Top), and the phosphopeptide isolated in fraction 4 was subjected to phosphoamino acid analysis (PAA), Edman degradation (Edman), and sequencing to determine the residue phosphorylated (indicated in red).

