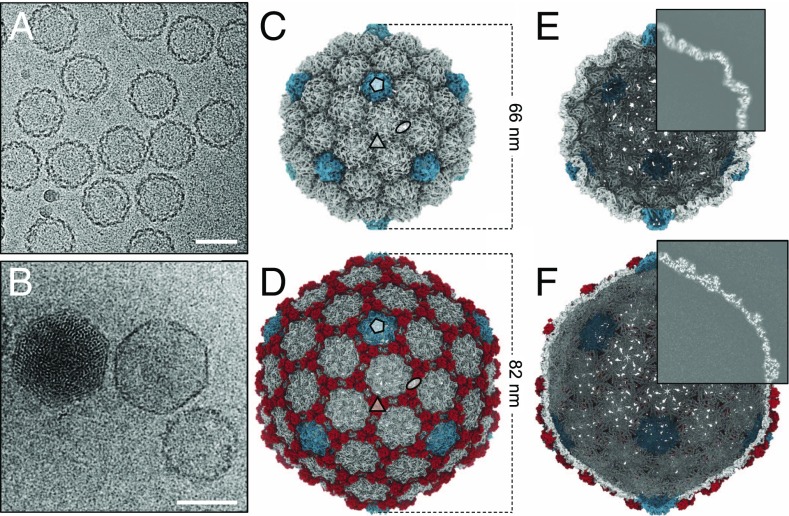
Fig. 1.
Cryo-EM analysis. Micrographs showing (A) procapsids and (B) DNA-filled capsid (left), empty expanded capsid (center), and empty procapsid (right). (Scale bars, 50 nm.) (C and D) Icosahedral 3D reconstruction of the (C) procapsid and (D) empty expanded capsid, symmetry axes indicated. Pentons are in cyan, auxiliary proteins in red. (E and F) Internal views of the (E) procapsid and (F) expanded capsid, with one-quarter of the reconstruction shown as a central slice.

