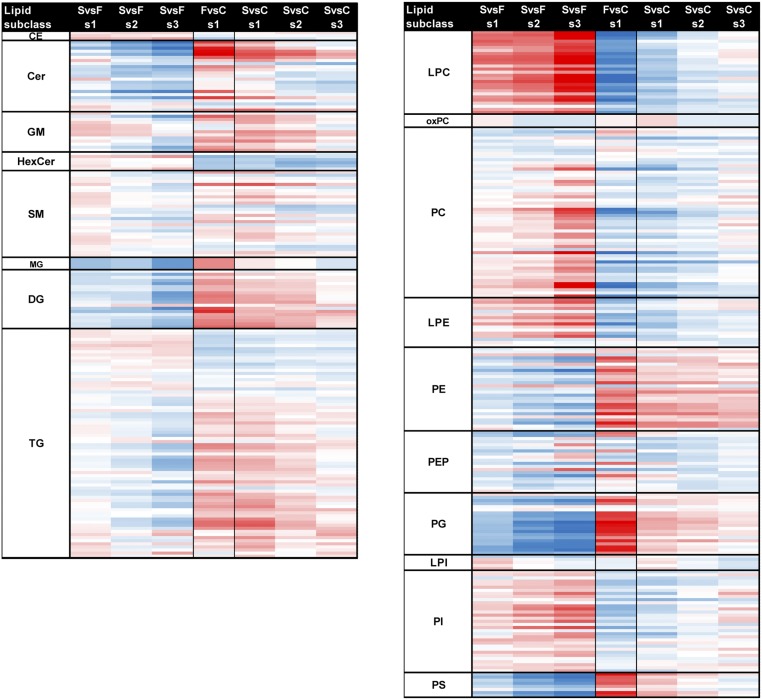
Fig. 2.
Global lipidome profile of EVD human plasma per lipid subclass. A total of 423 unique lipids across 379 LC-MS peaks were identified across four cateogories (glycerophospholipids, sterols, sphingolipids, and glycerolipids) and 19 subclasses. Average plasma lipid levels for EVD patients (F, fatalities; s1, s2, and s3, survivors’ first, second, and third samples) compared with healthy controls (C); or for s1/s2/s3 vs. F comparisons. Data in the heatmap are log2 FC values for each individual lipid. The lipids are sorted within each subclass level by the increasing total number of carbons in the hydrocarbon chains and then the total of double bonds. Values are scaled from −10 to +10 log2 FC going from blue (decrease) to white (no change) to red (increase), respectively. SvsF per s1, s2, s3 comparison values are displayed as the direction of expression in survivors. FvsC comparison values are displayed as the direction of expression in the fatalities sample. CE, cholesterol ester; GM, ganglioside; HexCer, glucosyl- or galactosylceramide; LacCer, lactosylceramide; LPE, monoacylglycerophosphoethanolamine; LPI, monoacylglycerophosphoinositol; MG, monoacylgleride; PEP, plasmalogen PE; and PG, diacylglycerophosphosphoglycerol or bis(monoacylglycerol)phosphate.

