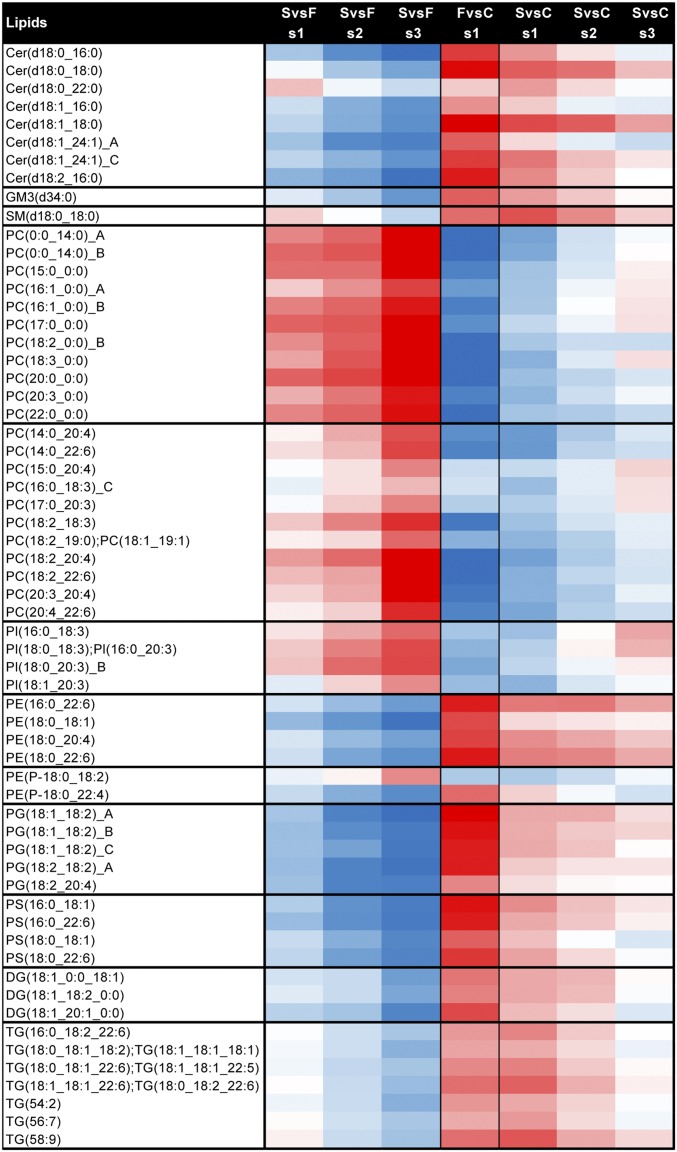
Fig. 3.
Lipids undergoing the greatest amount of change with EVD. Lipids with a value greater than 4.5 FC or below −4.5 FC between s1 and s3 for survivors (S) vs. fatalities (F) and survivors vs. healthy controls (C). Scale of log2 FC is the same as in Fig. 1 (blue down, white no change, and red up). Values are scaled from −10 to +10 log2 FC going from blue (decrease) to white (no change) to red (increase), respectively. Direction of expression is the same as in Fig. 1. GM, ganglioside; PC with 0:0 in annotation, monoacylglycerophosphocholine; PE, diacylglycerophosphoethanolmine; PEP, plasmalogen PE; PG, diacylglycerophosphosphoglycerol OR bis(monoacylglycerol)phosphate; and PS, diacylglycerophosphoserine.

