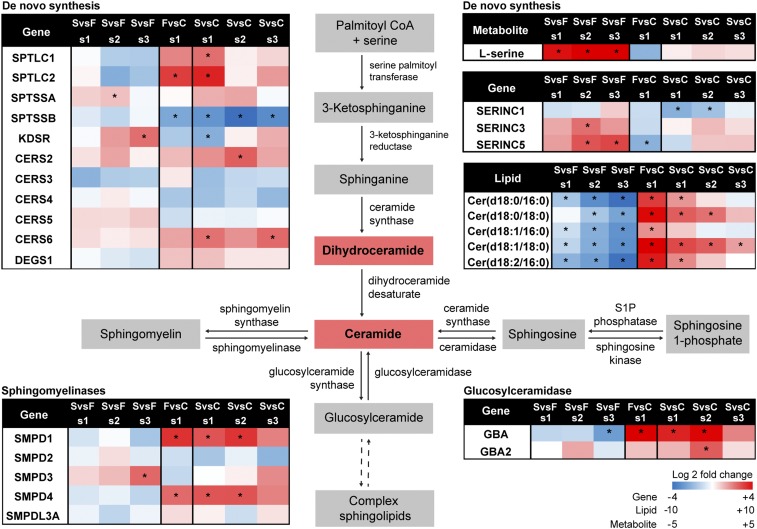
Fig. 5.
Multiomic sphingolipid metabolic pathway of EVD. Sphingolipid related transcripts in the PBMCs, ceramide lipids in the plasma as well as l-serine from the plasma are displayed on the sphingolipid metabolic pathway. Values are log2 FC scaled going from blue (decrease) to white (no change) to red (increase), respectively. Statistically significant molecules have a *P value of <0.05.

