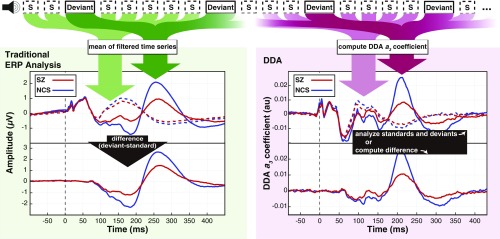
Fig. 4.
Subjects in both SZ and NCS groups were presented with auditory stimuli consisting of 50-ms standard tones with randomly interspersed 100-ms deviant tones. Data were analyzed according to a traditional ERP paradigm (Left) and using DDA to assess nonlinear dynamics (Right). In the standard ERP approach, EEG time series from standard (dashed lines) and deviant trials (solid lines) were averaged after preprocessing, and the difference waveform was computed from these averages. With DDA, a three-term delay differential equation was applied to the data, and the nonlinear coefficient was computed for both standard and deviant trials. Both ERP difference waveforms and the DDA coefficient time courses are aligned to tone onset, which is marked with vertical dashed lines at 0 ms.

