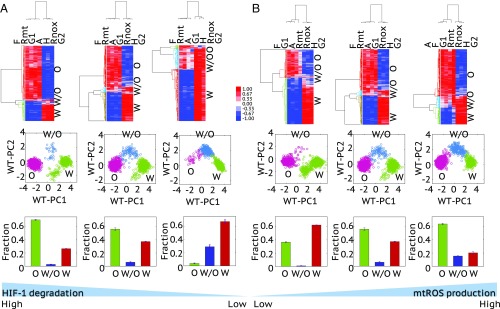
Fig. 4.
The effects of the HIF-1 degradation rate (A) and the mtROS production rate (B) on metabolic phenotypes. (A, Top) HCA of the stable-state solutions (referred to as samples here) of 1,000 sets of parameters with the degradation rate of HIF-1 being 0.45 , 0.25 , and 0.05 (from left to right). (A, Middle) Projection of the clustered samples at the top onto the PC1 and PC2 generated by the wild-type samples with the degradation rate of HIF-1 being 0.25 (referred to as WT-PC1 and WT-PC2). (A, Bottom) The fractions of the metabolic states, O, W/O, and W, corresponding to the top. The analysis was repeated three times and error bars were added. (B, Top) HCA of the stable-state solutions of 1,000 sets of parameters with the production rate of mtROS being 30, 50, and 80 μM/min (from left to right). (B, Middle) Projection of the clustered samples in the corresponding top onto the PC1 and PC2 generated by the wild-type samples, with the production rate of mtROS being 50 μM/min. (B, Bottom) The fractions of the metabolic states, O, W/O, and W, corresponding to the top. The analysis was repeated three times and error bars were added. The middle figures in A and B are the same with the parameters and = 50 μM/min, representing the wild type. Z-scores of the stable-state solutions were used for clustering analysis and PCA. The solutions of all scenarios here were normalized using the mean and SD of the wild type.

