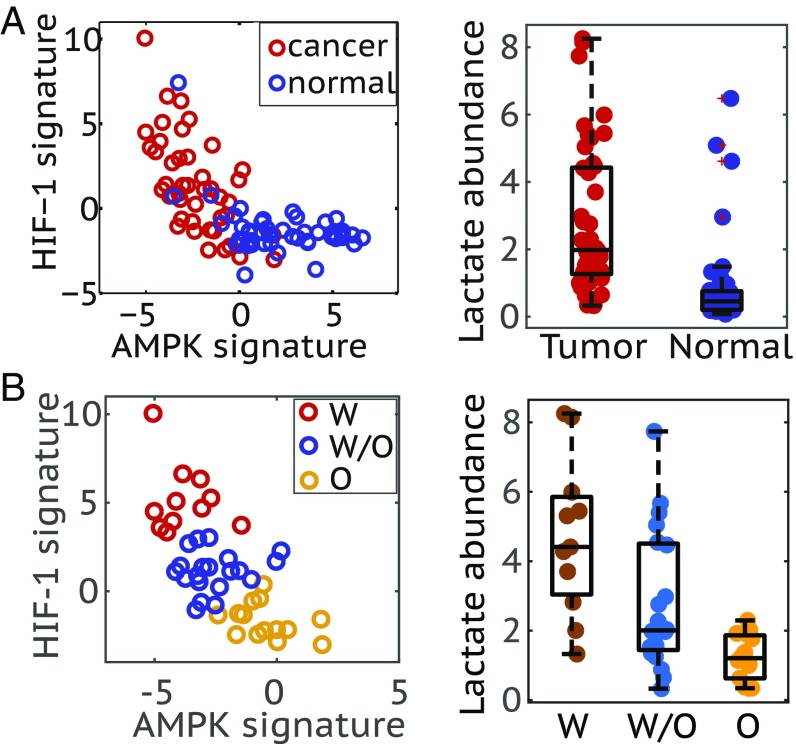
Fig. 5.
Association of the AMPK/HIF-1 activity with lactate abundance in human breast tumor samples. (A, Left) Evaluating the AMPK and HIF-1 activities of BC patients’ samples (n = 45) and the corresponding normal samples (n = 45). (A, Right) Box plot for lactate abundance in tumor and normal samples (P < 0.0001). (B, Left) Strong anticorrelation of AMPK and HIF-1 activity of tumor samples (Pearson correlation, r = −0.67, P < 0.0001). The standard k-means clustering analysis was applied to group the tumor samples into the W, O, and W/O states. (B, Right) Box plot for lactate abundance of samples in the W, O, and W/O states (PW-W/O < 0.05, PW/O-O < 0.01).

