Fig. 2.
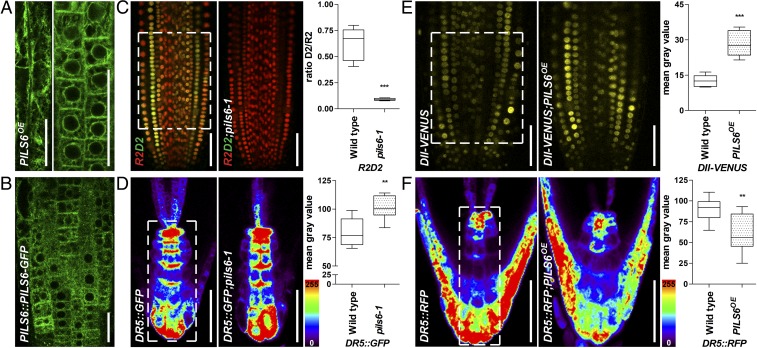
ER-localized PILS6 affects the nuclear availability of auxin. (A and B) PILS6 localizes to the ER. Confocal images of PILS6-GFP in the elongated (Left image) and meristematic (Right image) cells of PILS6OE (A) and meristematic cells of PILS6::PILS6-GFP (B) show ER-like distribution in roots. (C–F) PILS6 affects auxin signaling. Merged confocal images of R2 (red) and D2 (green) expressing R2D2 marker and quantification of D2/R2 ratio (C) show enhanced degradation of D2 signal in the pils6-1 mutant. Pseudocolored confocal images and fluorescence intensity quantification of DR5rev::GFP (D) or DR5rev::mRFP1er (F) in the root tip show stronger signal in the pils6-1 (D) and weaker signal in the PILS6OE (F) compared with the wild type. Note that in the pseudocolored visualization, red indicates high and blue indicates low intensity (see the color code bar). Confocal images and quantification of DII-VENUS (E) show enhanced fluorescence in the PILS6OE compared with the wild type. The white dashed boxes represent defined ROIs used to quantify the respective signal intensities. [Scale bars, 50 μm (A–F).] n = 9 (C), 6 (D), 7 (E), and 6 (F) roots. **P = 0.001–0.01, ***P < 0.001, Student’s t test.

