Fig. 1.
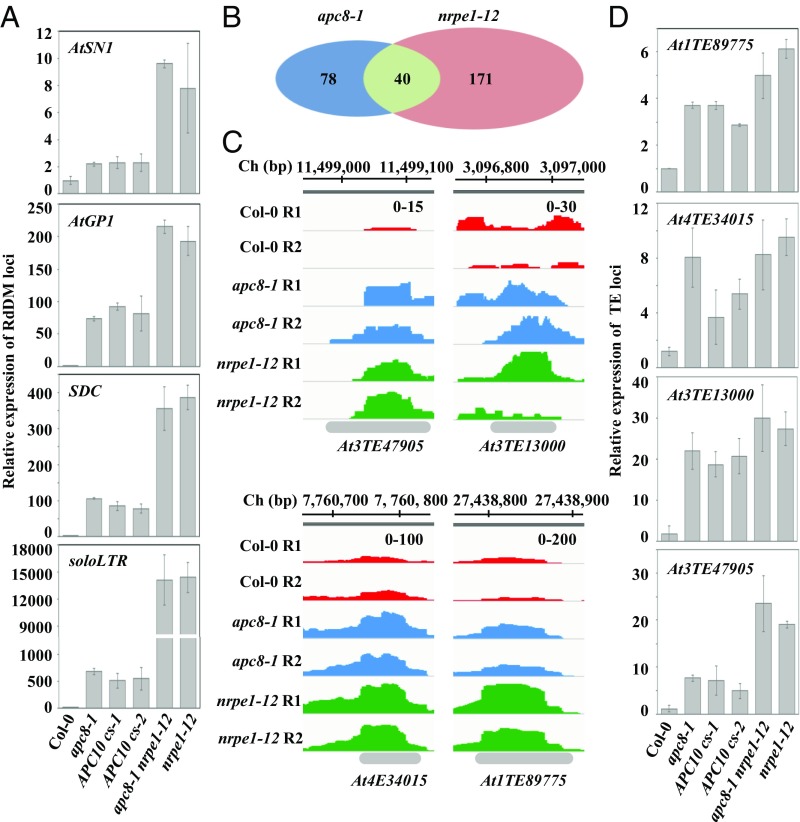
APC/C is required for a subset of TE silencing. (A) Effect of apc8-1 and cs lines of APC10 on transcriptional silencing as determined by qRT-PCR. Transcript levels of RdDM loci AtSN1, AtGP1, soloLTR, and SDC were measured. The UBQ5 gene was amplified as an internal control. Data are presented as mean ± SE (n = 3). (B) Overlap of de-repressed TEs from RNA-sequencing between apc8-1 and nrpe1-12. The Venn diagram shows the number of de-repressed TEs between apc8-1 and nrpe1-12. P = 4.217 × 10⁻¹⁰, calculated by the Pearson’s χ2 test with the Yates’ continuity correction. (C) Normalized expression levels of transcripts from selected TE loci in Col-0, apc8-1, and nrpe1-12. Peaks of RNA sequencing in each genotype are indicated by different colors. The x axis indicates the chromosomal location of TEs, and the y axis indicates normalized peaks. The same scales (“0–100” indicates numbers of normalized reads coverage) are identical for each genotype. Ch, chromosome; R1, replicate 1; R2, replicate 2. (D) Validation of TEs identified from RNA sequencing by qRT-PCR. UBQ5 was amplified as an internal control. Data are presented as mean ± SE (n = 3).

