Significance
Huntington’s disease is a fatal neurodegenerative condition arising from polyglutamine expansion within the Huntingtin protein leading to fibril accumulation in neurons. The initial multimerization events occur on the submillisecond timescale and involve sparsely populated species that can be probed at atomic resolution by NMR. Using a minimalistic construct comprising the N-terminal amphiphilic domain and seven glutamines, we uncover a branched oligomerization pathway, one leading to a tetramer comprising a dimer of coiled-coil helical dimers, and the other resulting in a nonproductive, partially helical, dimer. The results illuminate the contribution of the N-terminal amphiphilic domain in prenucleation events that precede fibril formation.
Keywords: prenucleation, kinetics, relaxation-based NMR, EPR, structure
Abstract
The N-terminal region of the huntingtin protein, encoded by exon-1, comprises an amphiphilic domain (httNT), a polyglutamine (Qn) tract, and a proline-rich sequence. Polyglutamine expansion results in an aggregation-prone protein responsible for Huntington’s disease. Here, we study the earliest events involved in oligomerization of a minimalistic construct, httNTQ7, which remains largely monomeric over a sufficiently long period of time to permit detailed quantitative NMR analysis of the kinetics and structure of sparsely populated oligomeric states, yet still eventually forms fibrils. Global fitting of concentration-dependent relaxation dispersion, transverse relaxation in the rotating frame, and exchange-induced chemical shift data reveals a bifurcated assembly mechanism in which the NMR observable monomeric species either self-associates to form a productive dimer (τex ∼ 30 μs, Kdiss ∼ 0.1 M) that goes on to form a tetramer ( μs; Kdiss ∼ 22 μM), or exchanges with a “nonproductive” dimer that does not oligomerize further (τex ∼ 400 μs; Kdiss ∼ 0.3 M). The excited state backbone chemical shifts are indicative of a contiguous helix (residues 3–17) in the productive dimer/tetramer, with only partial helical character in the nonproductive dimer. A structural model of the productive dimer/tetramer was obtained by simulated annealing driven by intermolecular paramagnetic relaxation enhancement data. The tetramer comprises a D2 symmetric dimer of dimers with largely hydrophobic packing between the helical subunits. The structural model, validated by EPR distance measurements, illuminates the role of the httNT domain in the earliest stages of prenucleation and oligomerization, before fibril formation.
Polyglutamine [poly(Q)] expansion, arising from mutations that extend the length of glutamine-encoding CAG repeats, is associated with a number of neurodegenerative diseases (1), the best known of which is Huntington’s disease, an autosomal dominant condition characterized pathologically by widespread neuronal degeneration and clinically by involuntary jerky movements (hence the name Huntington’s chorea), dementia, and ultimately death (2, 3). The gene responsible is Huntingtin (HTT), and the poly(Q) tract is encoded within exon 1 (3). Although the Huntingtin protein (htt) is very large (∼350 kDa), proteolysis (4) and/or incomplete mRNA splicing of HTT (5) generates mutated N-terminal fragments that aggregate to form neuronal inclusion bodies in pathological states (6). The N-terminal fragment (httEx1), corresponding to the first exon of HTT, comprises three domains (3): a 16-residue N-terminal amphiphilic sequence (httNT), a poly(Q) tract of variable length, and a proline-rich domain (Fig. 1A). The mean length of the poly(Q) repeat ranges from 17 to 20; lengths of 36 or greater result in Huntington’s disease (3), with the age of clinical onset being inversely correlated to the length of the poly(Q) segment (2, 7).
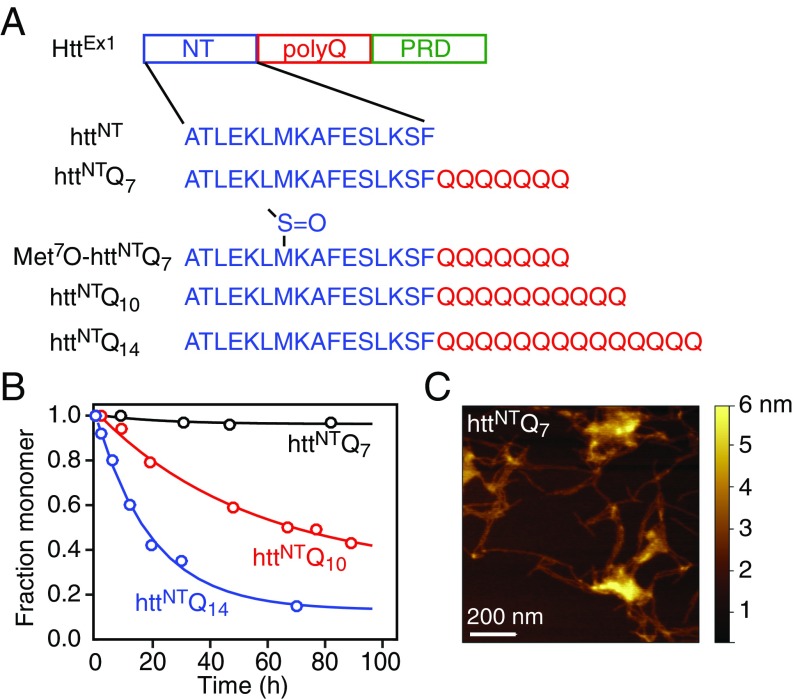
Fig. 1.
Characterization of httNTQn. (A) Organization of httEx1 and httNTQn sequences used in the current work. NT, N-terminal amphiphilic sequence; poly(Q), polyglutamine domain; PRD, proline-rich domain. (B) Fraction of monomer as a function of incubation time at 10 °C, measured from the intensity of the amide proton envelope in the first increment of a 1H–15N HSQC spectrum, for httNTQn with n = 7 (1 mM), 10 (100 μM), and 14 (100 μM). (C) Atomic force microscopy image of fibrils of httNTQ7 obtained after incubation for 3 weeks at 10 °C of 0.6 mM httNTQ7 in 20 mM phosphate buffer, pH 6.5, and 50 mM NaCl.
HttEx1 self-assembles to form prefibrillar oligomers and fibrils, both of which are neurotoxic in cell culture (2, 8). The rate of poly(Q) aggregation is greatly accelerated by the presence of the httNT sequence and down-regulated by the proline-rich domain (9, 10). Solid-state NMR has shown that httEx1 fibrils consist of a static polyglutamine β-hairpin/β-sheet core, connected by interdigitating glutamine side chains (11–13) and surrounded by httNT helices of intermediate dynamics (14–16). It has been postulated that the httNT sequence self-associates to form a helical coiled coil, and mutations engineered to enhance coiled-coil propensity promote aggregation, while those that disrupt coiled-coil formation have the reverse effect (17). These results, as well as other biophysical studies (18), have led to the hypothesis that the httNT domain of httEx1, as well as of other poly(Q) proteins, is a functional switch for the initial nucleation event that eventually leads to protofibril and fibril formation (17).
The earliest transient association events in httEx1 protofibril and fibril assembly, especially those involving sparsely populated, spectroscopically invisible states, are difficult to study as httEx1 aggregates relatively rapidly in vitro even for nonpathogenic poly(Q) lengths (18). However, amyloid nucleation of httNT-poly(Q) peptides (httNTQn) can be slowed down by reducing the length of the poly(Q) repeat (19). Here, we take advantage of a construct comprising only seven glutamines, httNTQ7, to probe the kinetics and structural features of highly transient multimeric species (with lifetimes less than 1 ms) formed during the earliest association events by quantitative analysis of concentration-dependent Carr–Purcell–Meiboom–Gill (CPMG) relaxation dispersion (20, 21), rotating frame R1ρ dispersion (22), transverse relaxation in the rotating frame and exchange-induced chemical shift (23) data, as well as NMR intermolecular paramagnetic relaxation enhancement (PRE) measurements (24, 25) and pulse double electron–electron resonance (DEER) (26) and continuous-wave (CW) (27) EPR. We demonstrate the existence of two branching pathways: the first involves self-association to a tetrameric helical bundle via a helical coiled-coil dimer; the second results in the formation of a nonproductive dimer (with partial helical character). Oxidation of the single methionine at position 7 of the httNT region abolishes all association, as does removal of the Q7 sequence. These results provide a detailed mechanistic picture of oligomer assembly occurring at the very earliest stages along the aggregation pathway of httEx1 that eventually leads to fibril nucleation and formation.
Results and Discussion
Seven Glutamines Are Sufficient to Induce Slow Fibril Formation.
Given the necessity of stable samples over prolonged periods of time needed for detailed analysis of exchange dynamics by NMR, we focused on four N-terminal httEx1 peptide fragments (Fig. 1A): the 16-residue N-terminal peptide, httNT, with no glutamine repeats [as the N-terminal methionine is likely cleaved in vivo (28)]; a 23-residue peptide with seven glutamines C-terminal to the httNT sequence, httNTQ7 (SI Appendix, Fig. S1); (Met7O)-httNTQ7 in which the side chain of Met7 was oxidized to a sulfoxide by mild treatment with hydrogen peroxide (SI Appendix, Fig. S2); and 26- and 30-residue peptides with 10 and 14 glutamines C-terminal to the httNT sequence, httNTQ10 and httNTQ14. The 1H–15N correlation spectra of all constructs are typical of intrinsically disordered peptides with very limited backbone amide proton spectral dispersion (SI Appendix, Figs. S1A and S2), and the backbone secondary chemical shifts of httNTQ7 give no indication for any significant secondary structure propensity (SI Appendix, Fig. S1B) under the experimental conditions employed throughout the current work (5 or 10 °C, 20 mM sodium phosphate, pH 6.5, 50 mM NaCl). We followed aggregation by monitoring the decrease in intensity of the 15N-labeled monomer 1H–15N cross-peaks arising from the formation of very high–molecular-weight species whose resonances are broadened beyond the limits of detection. Both httNT and (Met7O)-httNTQ7 are stable monomers under these conditions. Also, httNTQ7 is largely monomeric over a period of 3 weeks from initial dissolution at 10 °C [see analytical ultracentrifugation (AUC) data in SI Appendix, Fig. S3] with a 1 mM solution displaying only a minimal decrease in 1H–15N cross-peak intensities (>95% monomer, Fig. 1B). Only after about 3 weeks can the presence of amyloid-like fibrils be detected by atomic force microscopy (Fig. 1C). Under the same conditions, however, 100 μM solutions of httNTQ10 and httNTQ14 aggregate too rapidly at 10 °C for detailed NMR studies with monomer half-lives of ∼65 and ∼18 h, respectively (Fig. 1B). Thus, httNTQ7 provides an ideal system for probing monomer–oligomer exchange dynamics on the submillisecond timescale by relaxation dispersion NMR under conditions where the populations of the oligomeric states are low.
Relaxation Dispersion, Rotating Frame Transverse Relaxation, and Exchange-Induced Shifts.
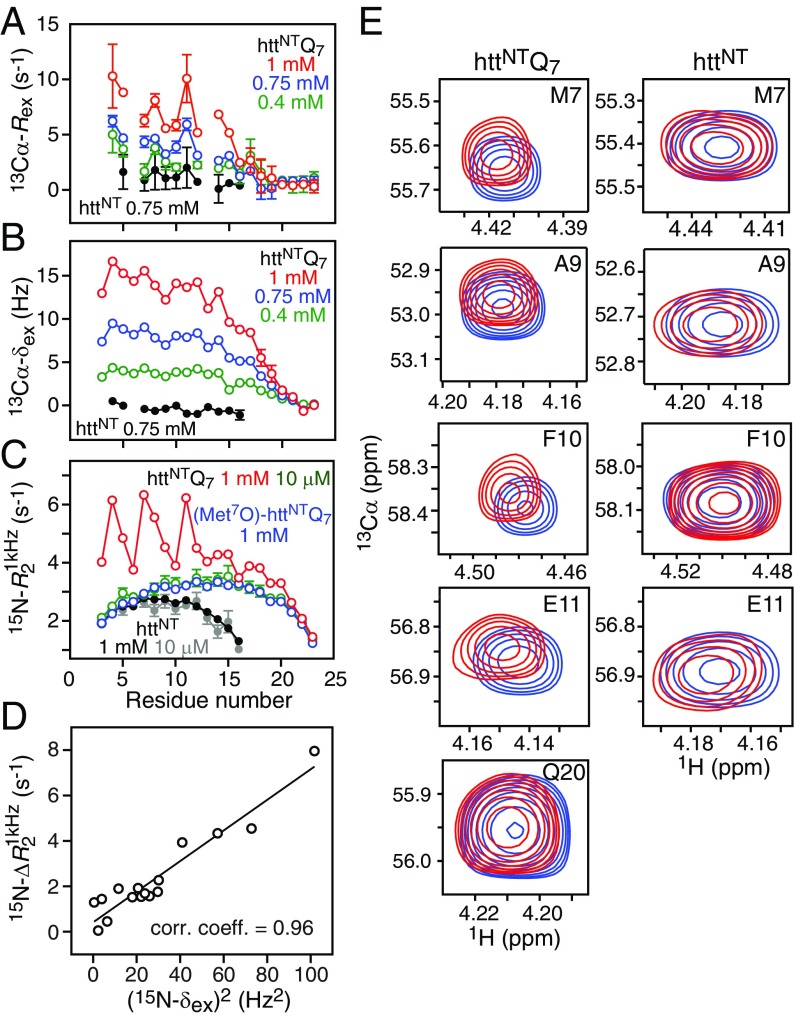
The httNTQ7 construct displays concentration-dependent 13Cα exchange-line broadening (13Cα-Rex), 13Cα exchange-induced shifts (13Cα-δex), and 15N transverse relaxation rates measured from 15N-R1ρ experiments recorded with a 1-kHz radiofrequency field (RF) spin lock (Fig. 2). In contrast, neither httNT nor (Met7O)-httNTQ7 show any change in these parameters with concentration. Thus, httNTQ7 must undergo rapid interconversion between the major monomeric species and minor, sparsely populated, higher-order oligomeric species. In addition, is correlated to 15N-δex2 (Fig. 2D and SI Appendix, Figs. S4 and S5). Thus, the increase in as a function of concentration is a hallmark of a fast exchange process that is not suppressed by the 1-kHz RF spin-lock field, and can be attributed to exchange between species with different chemical shifts (chemical exchange line broadening) on the submillisecond timescale, as opposed to lifetime line broadening arising from exchange between species with very different molecular weights and tumbling times (29). Furthermore, 15N dark state exchange saturation transfer experiments (30) show no evidence of any detectable exchange process between the NMR visible monomer and large molecular weight species.
Fig. 2.
Concentration-dependent exchange dynamics of httNTQ7 observed by NMR. (A) 13Cα exchange line-broadening measured by CPMG relaxation dispersion at 600 MHz and (B) 13Cα exchange induced shifts (13Cα-δex = δobs − δref) for httNTQ7 (800 MHz) at three concentrations (0.4, 0.75, and 1 mM) and httNT (900 MHz) at one concentration (0.75 mM) and 5 °C. For httNTQ7, the reference shifts, δref, in the absence of exchange were determined by fitting the concentration dependence of the observed shifts, δobs, for each residue to a second-order polynomial (SI Appendix, SI Materials and Methods); for httNT, the reference shifts are obtained from the spectrum recorded on a 20 μM sample. (C) transverse relaxation rate profiles obtained from 15N-R1ρ measurements at 600 MHz and 10 °C recorded with a spin-lock radiofrequency field strength of 1 kHz for httNTQ7 (10 μM and 1 mM), (Met7O)-httNTQ7 (1 mM), and httNT (10 μM and 1 mM). (D) Correlation of and (15N-δex)2 for httNTQ7 at 800 MHz and 5 °C. (E) Expansion of selected regions of the 900-MHz 1H–13C constant time HSQC spectra of 0.8 mM (blue) and 20 μM (red) samples of httNTQ7 (Left) and httNT (Right) at 5 °C. Error bars represent 1 SD (when not shown, they are within the circles representing the experimental data).
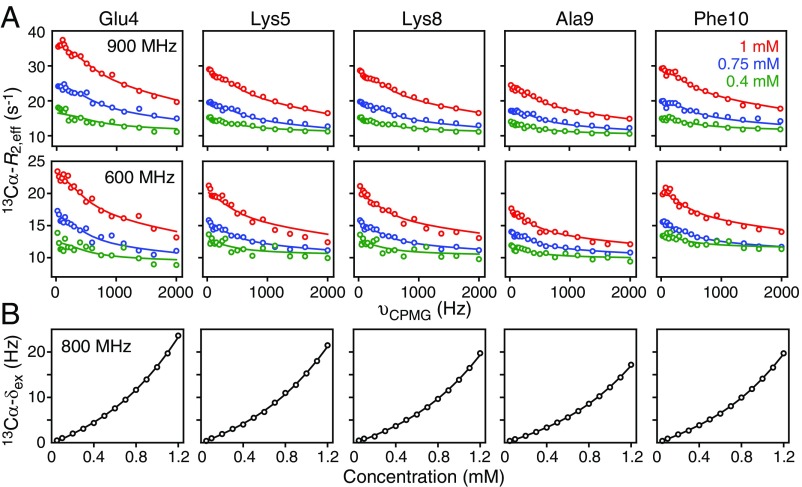
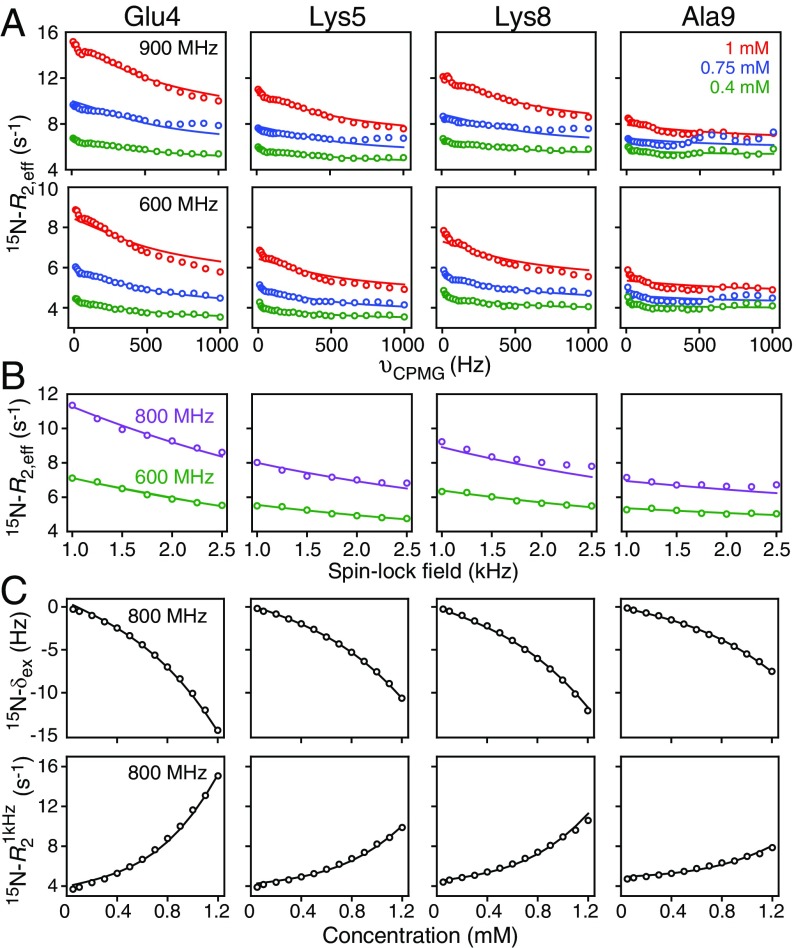
To quantitatively explore the exchange phenomena for httNTQ7, we collected 13Cα (Fig. 3A) and 15N (Fig. 4A) CPMG relaxation dispersion experiments at three (0.4, 0.75, and 1 mM) concentrations, 15N R1ρ dispersion experiments at one concentration (1 mM, Fig. 4B), 13Cα (Fig. 3B and SI Appendix, Fig. S6) and 15N exchange-induced shifts (Fig. 4C, Top and SI Appendix, Fig. S4), and data (Fig. 4C, Bottom, and SI Appendix, Fig. S5) at 13 concentrations from 50 μM to 1.2 mM. (Note that the number and range of concentrations used for the CPMG relaxation dispersion experiments was limited by signal-to-noise considerations; further CPMG relaxation dispersion experiments could not be carried out above 1 mM as some aggregation, resulting in a 10–15% loss of NMR signal intensity, occurs over a period of 48 h at 1.2 mM, close to the solubility limit of httNTQ7; exchange-induced shift and data, however, can be recorded in a short period of time, allowing access to concentrations up to 1.2 mM.) These data, summarized in Table 1, were fit simultaneously by solving the appropriate McConnell equations (31) corresponding to a given kinetic scheme, optimizing the relevant rate constants, the differences in chemical shifts between major and minor species for each residue, and the transverse relaxation rates for each residue at each concentration (see SI Appendix for full details of the relevant kinetic equations and of the global fitting procedure; SI Appendix, Eqs. S1–S6).
Fig. 3.
Quantitative analysis of the concentration dependence of 13Cα CPMG relaxation dispersion profiles and 13Cα exchange-induced shifts for httNTQ7. Representative (A) 13Cα CPMG relaxation dispersion profiles at 900 MHz (Top) and 600 MHz (Bottom), and (B) 13Cα exchange-induced chemical shifts (δex) at 800 MHz. The experimental data, recorded at 5 °C, are shown as circles. The best-fit curves from a global fit to the kinetic model shown in Fig. 5 are represented by the continuous lines. The CPMG relaxation dispersion data were recorded on a 13Cα/15N-labeled sample, while the exchange-induced shift data were recorded on a uniformly 13C/15N-labeled sample.
Fig. 4.
Quantitative analysis of the concentration dependence of 15N-relaxation dispersion profiles and exchange-induced shifts for httNTQ7. Representative (A) 15N-CPMG relaxation dispersion profiles at 900 MHz (Top) and 600 MHz (Bottom) at three concentrations (1, 0.75, and 0.4 mM), (B) 15N-R1ρ relaxation dispersion profiles at 800 and 600 MHz at a concentration of 1 mM, and (C) 15N-δex exchange-induced chemical shifts (Top) and (Bottom) at 800 MHz. The experimental data, recorded at 5 °C, are shown as circles. The best-fit curves from a global fit to the kinetic model shown in Fig. 5 are represented by the continuous lines. The relaxation dispersion data were recorded on a 13Cα/15N-labeled sample, while the exchange-induced shift and data were recorded on a uniformly 13C/15N-labeled sample.
Table 1.
Experimental data used in global fits
| Experiment | Magnetic field, MHz | Residue number* | Concentrations, mM |
| 13Cα-CPMG relaxation dispersion | 600, 900 | 4, 5, 8, 9, 10, 11, 12, 14, 16, 17 | 0.4, 0.75, 1.0 |
| 13Cα-δex | 800 | 4, 5, 8, 9, 10, 11, 12, 14, 16, 17 | 0.05, 0.1, 0.2, 0.3, 0.4, 0.5, 0.6, 0.7, 0.8, 0.9, 1.0, 1.1, 1.2 |
| 15N-CPMG relaxation dispersion | 600, 900 | 4, 5, 8, 9, 12, 15, 17 | 0.4, 0.75, 1 |
| 15N-R1ρ relaxation dispersion | 600, 800 | 4, 5, 8, 9, 12, 15, 17 | 1.0 |
| 15N-δex | 800 | 4, 5, 8, 9, 12, 15, 17 | 0.05, 0.1, 0.2, 0.3, 0.4, 0.5, 0.6, 0.7, 0.8, 0.9, 1.0, 1.1, 1.2 |
| 800 | 4, 5, 8, 9, 12, 15, 17 | 0.05, 0.1, 0.2, 0.3, 0.4, 0.5, 0.6, 0.7, 0.8, 0.9, 1.0, 1.1, 1.2 |
Residues not included in the global fit are those where there is either chemical shift overlap precluding accurate measurement of relaxation dispersion data or where the dispersions are small.
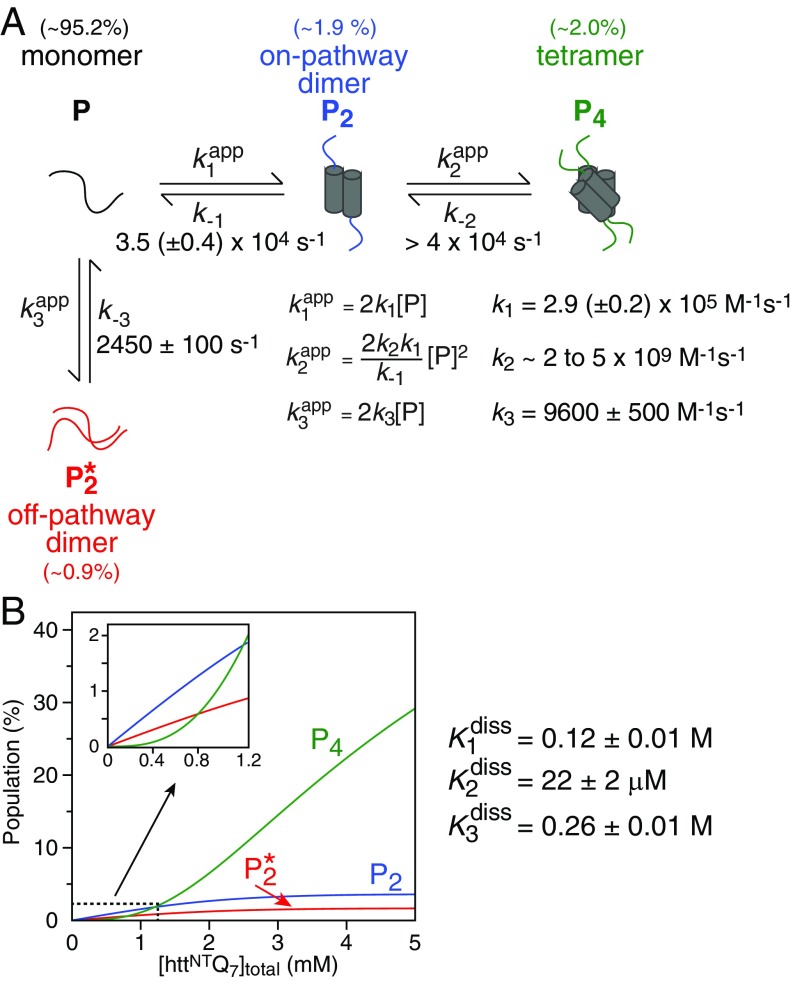
The distinct curvature in the concentration dependence of the exchange-induced shift (Figs. 3B and 4C and SI Appendix, Figs. S4 and S6–S9) and (Fig. 4C and SI Appendix, Fig. S5) data are indicative of the formation of higher-order (>2) oligomers. The simplest model that can fit all of the NMR data simultaneously is depicted in Fig. 5A and involves a branching pathway. The monomer, P, is the NMR observable species. In the first branch, P self-associates to form a productive dimer, P2, that further self-associates to form a tetramer, P4. In the second branch, P self-associates to form a “nonproductive” dimer, , which does not undergo further oligomerization.
Fig. 5.
Kinetic model used to fit the relaxation dispersion and exchange-induced shift data. (A) The kinetic model involves two pathways, one leading to the formation of a tetramer (P4) via a productive dimer (P2), and the other to a nonproductive dimer . See SI Appendix for full details of the relevant kinetic equations (SI Appendix, Eqs. S1–S5). The expressions for the concentration dependence of the apparent pseudo–first-order association rate constants, as well as the optimized values of the association and dissociation rate constants, are shown. The population of the various species at [httNTQ7] = 1.2 mM, the highest concentration used in the NMR experiments, is provided above each species. (B) Simulation of the species’ populations (in monomer units) as a function of total peptide concentration using the rate constants determined from the global best-fits to the NMR data. The Inset shows an expanded view of the dependence over the concentration range of the experiments (50 μM to 1.2 mM).
Alternative simpler kinetic models were also considered but eliminated on the basis of goodness-of-fit in the simultaneous analysis of all available concentration-dependent NMR data, and/or the ability of a given kinetic scheme to provide physically plausible parameters of exchange, transverse relaxation rates of the major (monomeric) species and chemical shifts of the minor (oligomeric) species. Two-site exchange models such as P ↔ P2, P ↔ P3, and P ↔ P4, as well as a three-site branched exchange model (P2 ↔ P ↔ P4), fail to satisfy the relaxation dispersion and exchange-induced shift data simultaneously, and do not reproduce the concentration dependence of the exchange-induced shifts. Although the P ↔ P2 two-site exchange model can approximately fit the available CPMG relaxation dispersion data alone, unphysically high fitted values of are obtained at higher peptide concentrations, implying the existence of another (very fast) process that is not accounted for by two-site exchange. Three-site exchange models comprising an on-pathway dimeric intermediate leading either to a trimer or tetramer (32) were also investigated. The latter fit the experimental data slightly worse than the bifurcated four-site exchange model shown in Fig. 5 but, more importantly, can be disqualified as they result in (i) unrealistically high populations of the intermediate dimeric species (P2), typically exceeding ∼10% at the highest concentration (1.2 mM) used in the NMR experiments, that are inconsistent with other biophysical data obtained in the present work (e.g., analytical ultracentrifugation; SI Appendix, Fig. S3), and (ii) unphysically large (by absolute magnitude) values of the resulting changes in 13Cα and 15N chemical shifts (Δω) of at least one of the involved oligomeric species.
Because of the complexity of the scheme in Fig. 5, we made the simplifying assumption that the 13Cα and 15N chemical shifts of the productive dimer and tetramer are the same. This is reasonable as 13Cα and 15N backbone shifts are largely affected by secondary structure (33) which would be predicted to be the same in the productive dimer and tetramer, if the tetramer is a dimer of dimers. Exchange between the monomer (P) and nonproductive dimer occurs on a timescale of ∼400 μs and is largely probed by CPMG relaxation dispersion; the exchange processes between the monomer (P) and the productive dimer (P2) and between the productive dimer (P2) and the tetramer (P4) are approximately an order of magnitude faster and occur on timescales of ∼30 and μs, respectively, that are largely characterized by R1ρ dispersion, transverse relaxation in the rotating frame, and exchange-induced chemical shifts (23). The effects of the interplay of the fast and slow processes on both the CPMG relaxation dispersion profiles and the concentration dependence of the exchange-induced chemical shifts is discussed in detail in SI Appendix and SI Appendix, Fig. S10. Hence, a combination of these NMR techniques in conjunction with simultaneous analysis of all concentration-dependent data are necessary for a detailed characterization of the kinetics of oligomerization depicted in Fig. 5.
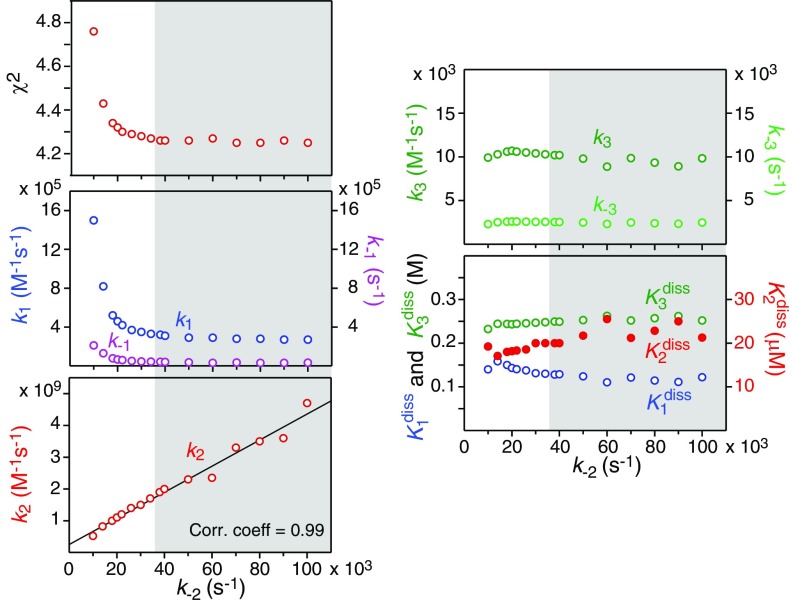
Initial fits indicated that the association (k2) and dissociation (k−2) rate constants for the P2 ↔ P4 exchange process could not be determined independently with any degree of certainty. We therefore carried out a grid search in which k−2 was held fixed at values spanning from 104 to 105 s−1, while optimizing all of the remaining parameters. The results are summarized in Fig. 6. Briefly, χ2 increases as the value of k−2 falls below about 4 × 10⁴ s−1; for values of , χ2 remains constant, and the values of k1 and k−1 for the P2 ↔ P4 exchange remain essentially unchanged. k2 and k−2 are highly correlated (correlation coefficient of 0.99), and the values of k3 and k−3 for the exchange remain stable for all values of k−2. Finally, the equilibrium dissociation constants, , and for the P ↔ P2, P2 ↔ P4, and processes, respectively, are stable for values of .
Fig. 6.
Global fitting results to all of the NMR data on httNTQ7 using a grid search on the value of the rate constant k−2 for the dissociation of tetramers (P4) into dimers (P2). The panels show the dependence of χ2 and the optimized values of the rate constants and equilibrium dissociation constants as a function of fixed values of k−2. The gray shaded region represents the range of k−2 where χ2 is at a plateau minimum.
The overall exchange rate between monomer and tetramer, , is approximately equal to k−2 at low httNTQ7 concentrations (<0.3 mM). At higher peptide concentrations, can be shown to be well approximated by k−2/n, where n varies from 1 to 4 for peptide concentrations ranging from 0.1 to 2.0 mM (and almost exactly 2 at the highest concentration of 1.2 mM used in the NMR experiments) for k−2 within the range of ∼40,000 to ∼60,000 s−1. The counterintuitive decrease in at higher concentrations is a consequence of the fact that the overall dissociation process from tetramer to monomer, as well as the association process from monomer to tetramer, are concentration dependent.
The concentration dependence of the populations of P2, P4, and simulated from the optimized values of the equilibrium dissociation constants is shown in Fig. 5B. The populations of P2 and plateaus at ∼3.8% and 1.6%, respectively, at a total peptide concentration of 5 mM, and then decay very slowly as the concentration increases further. The concentration dependence of the population of P4, on the other hand, is characterized by an initial lag phase followed by a rapid increase; at 5 mM total peptide concentration, the population of P4 reaches ∼29%. At the highest concentration used in the NMR experiments, the populations of P4, P2, and are ∼2.0%, 1.9%, and 0.9%, respectively (Fig. 5B, Inset).
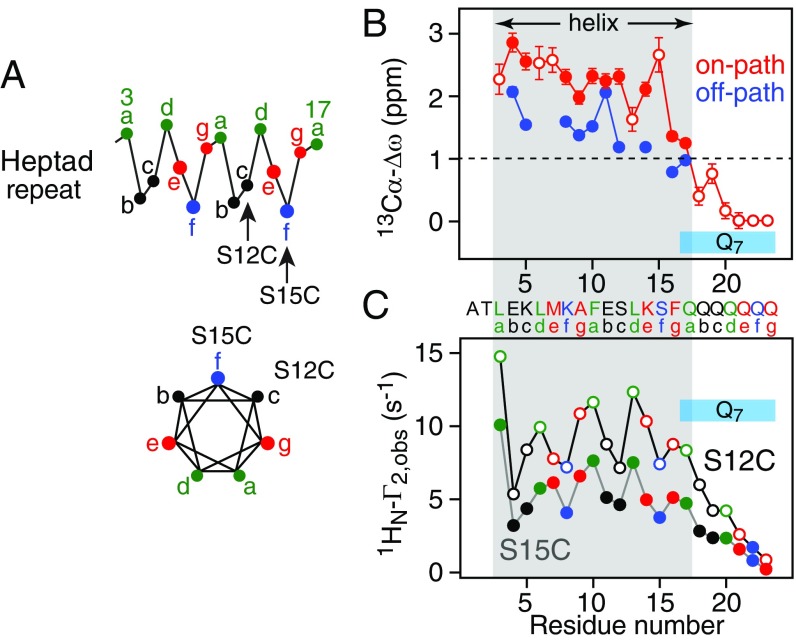
In addition to kinetic information, the relaxation dispersion and exchange-induced shift data provide structural information in the form of 13Cα (Fig. 7B) and 15N (SI Appendix, Fig. S11) chemical shift differences (Δω) relative to the intrinsically disordered monomer. The 13Cα-Δω values for residues 3–17 of P2/P4 range from +1 to +3 ppm (downfield shifts) with residues 3–12 and 14–15 having 13Cα-Δω values in excess of +2 ppm, indicative of a contiguous helix. The latter is consistent with the negative values of Δω (upfield shifts) for 15N, 13Cβ, and 1Hα nuclei of residues 3–17 (SI Appendix, Fig. S11), as well as the secondary structure assignment based on the backbone shifts using the program Talos (34). The 13Cα-Δω values for (off-path; Fig. 7B) are 50–100% smaller than the corresponding values for P2/P4 (on-path; Fig. 7B) but still represent downfield shifts, indicative of partial helix formation, for example due to an ensemble of partial helical coiled-coil conformations with different registers and hence different degrees of overlap.
Fig. 7.
13Cα-Δω profiles and intermolecular 1HN-PRE data for httNTQ7. (A) Heptad repeat parallel (Left) and orthogonal (Right) to the helix axis with positions a and d in green, e and g in red, b and c in black, and f in blue. (B) Calculated 13Cα-Δω for the productive dimer/tetramer (red) and the nonproductive dimer (blue) obtained from the global fits to the relaxation dispersion and exchange-induced shift data. The filled-in circles indicate residues used in the global fits; the 13Cα-Δω values calculated a posteriori from the exchange-induced shifts for residues not included in the global fits (either because chemical shift overlap precluded accurate measurement of dispersions or because the dispersions were very small) are represented by open circles (SI Appendix). (C) Intermolecular PRE 1HN-Γ2 profiles observed at 10 °C on 15N-labeled httNTQ7 in the presence of nitroxide spin-labeled S15C-R1 (filled-in circles) and S12C-R1 (open circles) GB1-httNTQ7 at a molar ratio of 1:40 nitroxide spin-labeled to 15N-labeled peptide. The color coding of the residues follows that of the heptad repeat shown in A. The total peptide concentration was 0.6 mM.
Modulation of Dimerization and Tetramerization Equilibria.
Since httNTQ7 was expressed as a fusion protein with the Ig-binding domain of streptococcal protein G (GB1) separated by a 10-residue linker, we also investigated the dimerization and tetramerization properties of the GB1-httNTQ7 fusion protein, as well as of two variants thereof with nitroxide (R1) spin labels covalently linked to engineered cysteines (S12C or S15C) in the httNTQ7 portion of the fusion protein. The latter were generated by conjugation of the cysteines to S-(1-oxyl-2,2,5,5-tetramethyl-2,5-dihydro-1H-pyrrol-3-yl)methyl methanesulfonothioate. GB1-httNTQ7 and GB1-httNTQ7 (S12C-R1) were characterized by sedimentation equilibrium AUC (SI Appendix, Figs. S12–S14), while GB1-httNTQ7 (S15C-R1) was investigated by sedimentation velocity AUC (SI Appendix, Fig. S15). The results are summarized in Table 2.
Table 2.
Monomer/dimer and dimer/tetramer equilibrium dissociation constants for various constructs of httNTQ7
| Equilibrium dissociation constants | |||
| Monomer/dimer | Dimer/tetramer | ||
| Sample | Method | ||
| httNTQ7 | NMR* | 0.12 ± 0.01 M | 22 ± 2 μM |
| GB1-httNTQ7 | AUC† | 9 ± 0.3 mM | μM |
| GB1-httNTQ7 (S15C-R1) | AUC‡ | 0.22 ± 0.01 mM | ND§ |
| EPR¶ | 0.49 ± 0.05 mM | ND§ | |
| GB1-httNTQ7 (S12C-R1) | AUC† | 0.58 ± 0.13 mM | 9 ± 3 μM |
| EPR¶ | 0.41 ± 0.04 mM | μM | |
From global fit to 15N and 13Cα relaxation dispersion experiments, 15N and 13Cα exchange-induced shifts and data over a range of concentrations (Figs. 3–5 and SI Appendix, Figs. S4–S6). NMR experiments were conducted at 5 °C in 20 mM phosphate (pH 6.5), 50 mM NaCl, and 10% D2O (vol/vol). The equilibrium dissociation constant for the off-pathway monomer/dimer equilibrium is 0.26 ± 0.01 M (Fig. 5).
Sedimentation equilibrium experiments were conducted at 20 °C in 50 mM sodium phosphate (pH 6.5) with 150 mM NaCl for GB1-httNTQ7 and 100 mM NaCl for GB1-httNTQ7 (SI Appendix, Fig. S12C).
Sedimentation velocity experiments were conducted at 20 °C in 50 mM sodium phosphate (pH 6.5) and 100 mM NaCl.
ND, not detectable. No tetrameric species was detectable for GB1-httNTQ7 (S15C-R1) either by sedimentation velocity AUC or EPR (Fig. 10B).
The DEER modulation depth as a function of concentration was measured by Q-band EPR at 50 K (Fig. 10C). Samples at room temperature were flash frozen in liquid nitrogen. The buffer was the same as in the corresponding AUC experiments with the addition of 30% (vol/vol) glycerol.
The GB1-httNTQ7 (SI Appendix, Figs. S12 and S13) and GB1-httNTQ7 (S12C-R1) (SI Appendix, Fig. S14) sedimentation equilibrium AUC data can only be fit to a reversible monomer–dimer–tetramer model with significant occupancy of the tetramer. At the highest concentrations used in the analysis (which are higher than the loading concentrations), ∼0.8 mM for GB1-httNTQ7 and ∼0.4 mM for GB1-httNTQ7 (S12C-R1), the tetramer populations (in monomer units) reach values of ∼40% (SI Appendix, Fig. S13B) and ∼60% (SI Appendix, Fig. S14B), respectively. Interestingly, the dimer–tetramer equilibrium for these two constructs is similar to that for httNTQ7 . However, the values of are ∼15- and 200-fold lower for GB1-httNTQ7 (∼9 mM) and GB1-httNTQ7 (S12C-R1) (0.58 mM), respectively, relative to that for httNTQ7 (∼0.12 M). Thus, the extent of tetramerization for these three constructs is predominantly determined by the stability of the dimer relative to the monomer. The increased stabilization of the dimer relative to the monomer as a consequence of the introduction of GB1 fused to the N terminus of httNTQ7 is presumably due to transient, weak interactions between the GB1 globular domain of one subunit and the polyglutamine tail of the other.
In contrast, sedimentation velocity AUC data indicate that GB1-httNTQ7 (S15C-R1) only undergoes dimerization with (SI Appendix, Fig. S15), a factor of ∼3 lower than that of httNTQ7 (S12C-R1). No evidence of any tetramer is apparent in the sedimentation velocity data.
Thus, apparently innocuous modifications, whether involving a fusion construct with a small globular protein at the N terminus, nitroxide spin-labeling within the httNT portion of the constructs, or even oxidation of Met7 (Fig. 2) can have a profound effect on both dimerization and tetramerization of httNTQ7.
PRE-Based Structural Modeling of the Productive Dimer and Tetramer of httNTQ7.
To derive a structural model of the httNTQ7 dimer and tetramer, we made use of intermolecular PRE measurements. When exchange is fast on the PRE relaxation time scale, intermolecular PREs observed on NMR visible 15N-labeled httNTQ7 in the presence of a small amount of a paramagnetically labeled httNTQ7 derivative at natural isotopic abundance, yield structural information on the sparsely populated, NMR invisible, oligomeric states (25). Note that the PRE experiments make use of a 1H–15N correlation-based pulse scheme, and hence PREs arising from proximity to the paramagnetic label are only detected on the 1HN protons of 15N-labeled httNTQ7 and not on the paramagnetically labeled derivative, which is at natural isotopic abundance.
Because of solubility and purification issues related to nitroxide-labeled httNTQ7 constructs, we made use of the GB1-httNTQ7 fusion protein labeled with a nitroxide (R1) at either S15C or S12C, both of which lie on the hydrophilic face of an amphiphilic helix (Fig. 7A). Experiments were carried out at a total peptide concentration of 0.6 mM with a molar ratio of 1:40 spin-labeled GB1-httNTQ7 to 15N-labeled httNTQ7, and the resulting intermolecular PRE profiles are shown in Fig. 7C. The large excess of 15N-labeled httNTQ7 ensures that the transient dimers and tetramers either contain only a single nitroxide-labeled subunit, or at best two nitroxide-labeled subunits owing to dimer enrichment of nitroxide-labeled GB1-httNTQ7 as a result of their low dimerization dissociation constants relative to httNTQ7 (0.2–0.6 mM versus ∼0.1 M, respectively; Table 2). The latter will only yield PREs between dimers (and not within dimers), and hence the interdimer PRE profile will be the same whether one or two subunits within one of the dimers are nitroxide labeled.
Three control experiments were carried out. PREs were measured on a 1:1 (as well as 1:9) mixture of httNTQ7 (S15C-R1) to 15N-labeled httNTQ7 (SI Appendix, Fig. S16A) and found to be highly correlated (R = 0.98) to those measured on a 1:40 mixture of GB1-httNTQ7 (S15C-R1) to 15N-labeled httNTQ7 (SI Appendix, Fig. S16B), indicating that the oligomeric structures are unaffected by the presence of the GB1 solubility tag on the nitroxide-labeled subunit. PRE experiments were also recorded on samples of 15N-labeled httNTQ7 in the presence of nitroxide-labeled GB1 or (Met7O)-httNTQ7 (which does not oligomerize). No intermolecular PREs were detected in the latter two samples (SI Appendix, Fig. S16A), indicating that the PREs observed on 15N-labeled httNTQ7 in the presence of nitroxide-labeled constructs of GB1-httNTQ7 are the result of specific association into well-defined multimers and do not arise from either nonspecific binding of the nitroxide label itself or to solvent PREs (25). In addition, the PRE data were collected at 10 °C, instead of 5 °C used for the other NMR experiments, to remove spectral overlap and permit PREs to be obtained for all residues within the helix. The PRE profiles, however, are the same at the two temperatures (SI Appendix, Fig. S17).
A qualitative inspection of the intermolecular PREs arising from nitroxide labels at S12C-R1 and S15C-R1 suggests a mixture of antiparallel and parallel helical arrangements as both PRE profiles follow an oscillatory pattern with similar magnitude at both the N- and C-terminal ends of the helix extending from residue 3 to residue 17 (Fig. 7C). In addition, the magnitude of the PREs decays beyond residue 17 and is small for the C-terminal three glutamines, confirming the conclusions from 13Cα chemical shifts (Fig. 7B) that the Q7 sequence becomes progressively disordered.
To model the structure of the httNTQ7 productive dimer (P2) and tetramer (P4), we made use of PRE-driven simulated annealing calculations using the program Xplor-NIH (35, 36). Full details of these calculations are provided in SI Appendix. Briefly, conjoined rigid body/torsion angle simulated annealing was employed with the backbone of residues 3–17 treated as a rigid idealized α-helix and the side chains given torsion degrees of freedom. In addition, strict symmetry was employed such that explicit degrees of freedom are only allowed for one subunit, the protomer, while the dimer-forming partner is computed by a 180° rotation about the z axis, and the full tetramer by rotating the dimer 180° along the axis of a line described by z = 0 and x = y. The dimer is C2 symmetric, and the tetramer is a dimer of dimers related to one another by D2 symmetry. The packing of the subunits is encoded in the absolute position in space of the protomer. Because the PRE restraints are limited, we assume that the structure of the productive dimer is exactly the same as that of the dimer within the tetramer. Of note, we also assume that the contribution of the unproductive dimer (; Fig. 5) to the observable PREs is negligible as its population is lower than those of the productive dimer and tetramer, and furthermore it is highly likely that comprises an ensemble of states and therefore any potential PREs arising from this ensemble are absorbed into the PRE background.
There are two additional complications that were addressed in computing the dimer/tetramer structure from the PRE data (see SI Appendix for details). First, we do not know the populations of the transient heterodimer and heterotetramers giving rise to the intermolecular PREs, nor the correlation times of the species. For this reason, we used a target function that minimizes the correlation coefficient between observed and calculated PREs (SI Appendix, Eqs. S7 and S8), rather than the sum squares of differences between observed and calculated PREs. Second, we do not know the relative population of dimer and tetramer. We therefore calculated a set of 11 structural ensembles ranging from 0% dimer/100% tetramer to 100% dimer/0% tetramer by appropriate weighting of the PREs, which takes into account the ratio of total correlation times expected for the dimer and tetramer. The exact ratio is not critical, and in the final calculations we assumed that the total correlation time (dominated by the rotational correlation time as the electron correlation time for a nitroxide is in excess of 100 ns) for the tetramer is 50% larger than that of the dimer. (Note that the heterotetramer is not double the molecular weight of the heterodimer.)
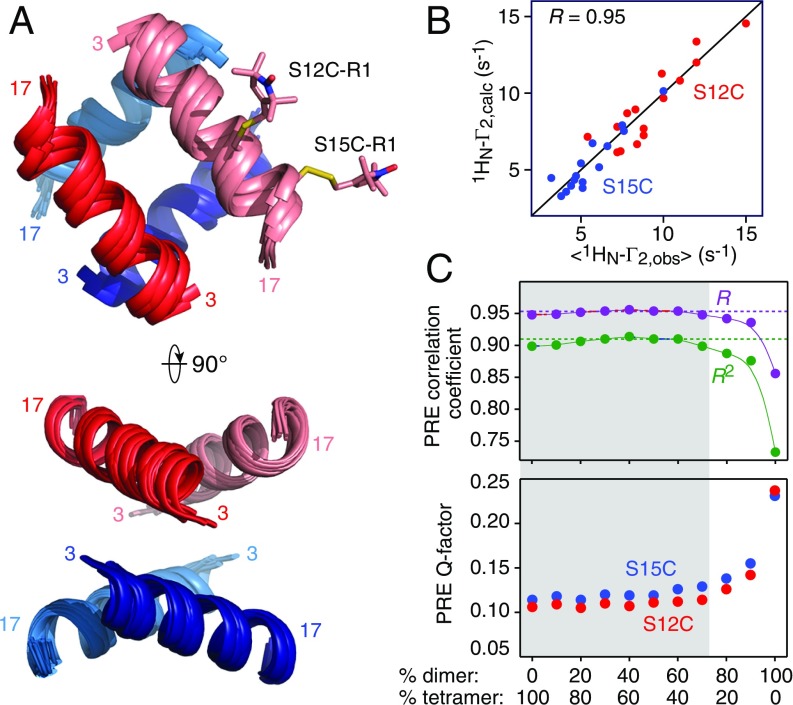
The results of the PRE-driven simulated annealing calculations are shown in Fig. 8 and SI Appendix, Fig. S18. A superposition of the lowest energy structures calculated with dimer to tetramer partitioning ranging from 90%:10% to 0%:100% is shown in Fig. 8A. The Cα atomic rms difference to the mean coordinate positions is 0.6 Å, and the overall correlation coefficient between observed and calculated PREs is 0.95 (Fig. 8B). Within each ensemble over this dimer-to-tetramer partitioning range, the Cα atomic rms precision for the 10 lowest energy structures ranges from ∼0.5 to ∼1 Å, and the average Cα rms difference of the 100 lowest energy structures is ∼0.9 Å. Thus, the structural model is robust over a wide range of dimer to tetramer partitioning. The structures calculated with 100% dimer converge poorly and fail to satisfy the intermolecular PRE data (Fig. 8C and SI Appendix, Fig. S18). The overall PRE correlation coefficient and PRE Q-factor between observed and calculated PREs remains stable over dimer:tetramer ratios of 70%:30% to 0%:100%, but at 80% dimer and above, a clear decrease in correlation coefficient and Q-factor becomes apparent (Fig. 8C and SI Appendix, Fig. S18).
Fig. 8.
PRE-based structure of the httNTQ7 tetramer. (A) Two orthogonal views showing ribbon diagrams of a superposition of the lowest energy, PRE-based structures from each ensemble calculated with dimer to tetramer partitioning ranging from 0%:100% to 90%:10%. The tetramer is a dimer of dimers, and the structure of the dimer (one shown in red and pink, and the other in blue and light blue) is assumed to be the same in the dimer and tetramer. The helix that extends from residues 3–17 is treated as a rigid body. (B) Correlation between observed and calculated PREs. The latter are the average of the calculated values of the lowest energy structures from each ensemble computed with dimer:tetramer populations ranging from 0%:100% to 90%:10%. The Pearson correlation coefficient R has a value of 0.95. Equivalent plots for the individual ensembles calculated at the different dimer-to-tetramer ratios are shown in SI Appendix, Fig. S18. (C) Plot of PRE correlation coefficient (Top, with R and R2 shown in purple and green, respectively) and PRE Q factor (Bottom, with the values for S12C-R1 and S15C-R1 shown in red and blue, respectively) as a function of dimer-to-tetramer partitioning (1 SD error bars lie within the circles). The PRE Q factor is given by (46). The gray shaded area indicates the likely range of partitioning of dimer-to-tetramer populations. The structures calculated with 100% dimer do not satisfy the experimental PRE data; the structures calculated with 80% and 90% dimer exhibit some degradation in agreement with the PRE data (as measured both by the correlation coefficient and the Q factor), although they are structurally very similar to the structures calculated with lower dimer populations.
The structure of the tetramer is a dimer of dimers (red/light red and blue/light blue in Fig. 8A) related by D2 symmetry, reminiscent of the helical components of the p53 tetramerization domain (37). The interhelical angle between the two helices of the dimer ranges from 145 to 155°, and the two interhelical angles between the dimers are ∼90 and 100°. (For the structures calculated with 100% dimer, which do not fit the PRE data, the angle between the helices of the dimer is increased to ∼170°.)
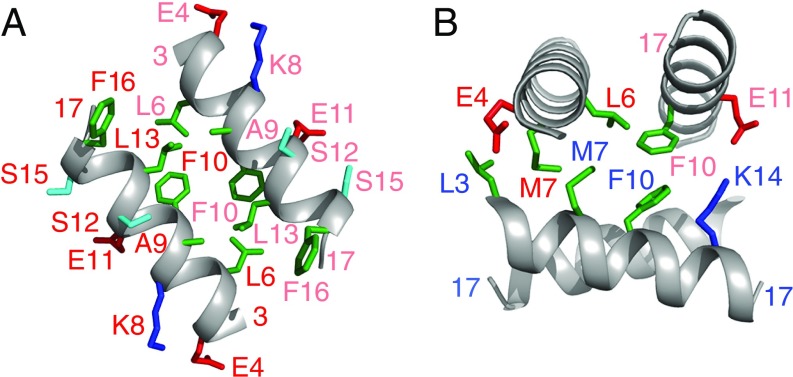
Side-chain packing between the helices of the dimer and between the dimer of dimers is shown in Fig. 9, respectively. Packing between helices of the dimer is hydrophobic and involves the side chains of Leu6, Ala9, Phe10, Leu13, and Phe16. The involvement of Phe16 at the dimer interface provides a rational basis for understanding why httNT alone undergoes no detectable self-association (Fig. 2): for the latter to occur, Phe16 must be part of the helix, which presumably requires a few additional C-terminal residues for stabilization. In this regard, we note that not only does the helix extend out to residue 17, but it is possible from both the 13Cα (Fig. 7B) and 15N (SI Appendix, Fig. S11) chemical shifts of the dimer/tetramer, as well as the PRE data (Fig. 7C), that residues 18, 19, and possibly even 20 may adopt partial helical character. The surface exposed side chains are hydrophilic (Glu4, Lys8, Glu11, Ser12, and Ser15), characteristic of an amphiphilic helix. The interface between the two dimers is predominantly hydrophobic (Leu3, Leu6, Met7, and Phe10), supplemented by a potential electrostatic interaction between Glu11 and Lys14. The presence of Met7 at the interface of the two dimers is also of interest since oxidation of the side chain Met7 to a sulfoxide abrogates self-association (Fig. 2C), presumably by inhibiting tetramer formation through the introduction of a bulky hydrophilic group within the tetramer core, potentially leading to steric clash between interacting methionine residues (Fig. 9B).
Fig. 9.
Side-chain interactions within and between dimer units of the httNTQ7 tetramer. (A) Contacts between subunits of the dimer (labeling of side chain for one of the subunits is in dark red, and for the other in light red). (B) Contacts within the tetramer between the two helices of one dimer and one helix of the other dimer. Labeling within the two dimer units of the tetramer is in dark red/light red and dark blue/light blue. Residue color coding is as follows: hydrophobic, green; positively charged, blue; negatively charged, red; hydrophilic, cyan.
Using EPR to Independently Validate the Structure of the Dimer Unit Within the httNTQ7 Tetramer.
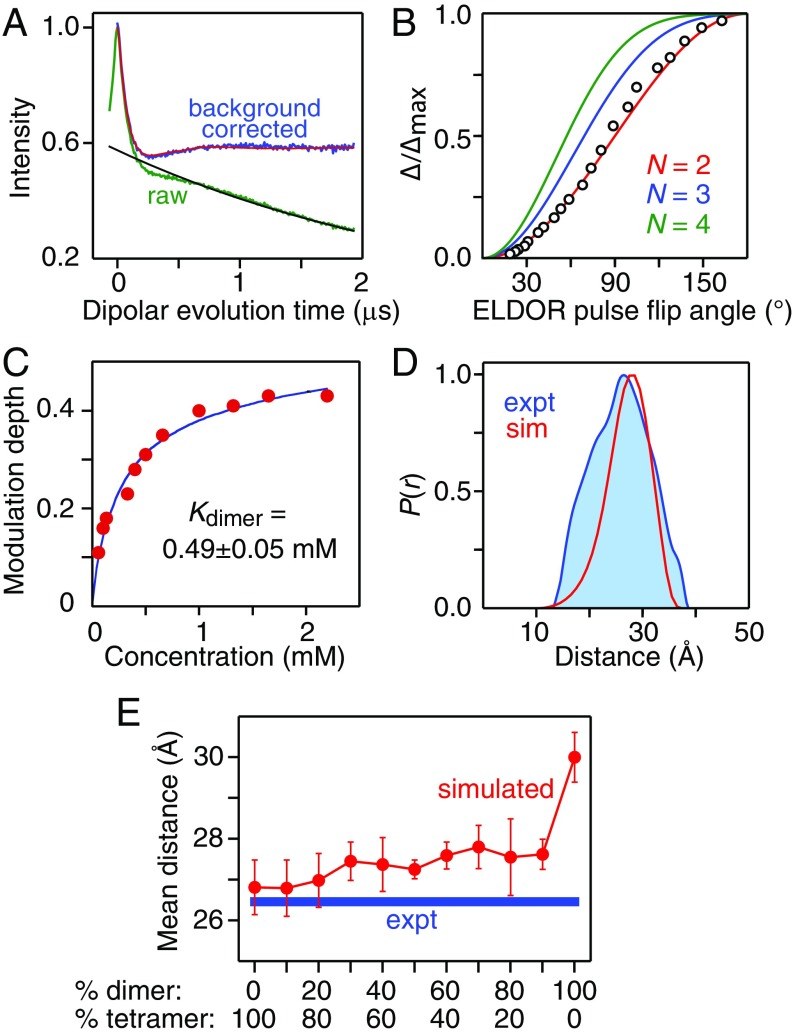
As noted above, sedimentation velocity AUC indicates that GB1-httNTQ7 (S15C-R1) only forms a dimer (Table 2 and SI Appendix, Fig. S15). To validate the intersubunit/intradimer distance between S15C-R1 labels in the PRE-derived structures, we used Q-band pulsed DEER EPR (26) at 50 K (Fig. 10). The raw and background-corrected DEER echo curves are shown in Fig. 10A. Inversion modulation DEER (IM-DEER) experiments (SI Appendix, Fig. S19) in which the normalized modulation depth, Δ/Δmax, is measured as a function of the ELDOR pulse flip angle (38) confirms that GB1-httNTQ7 (S15C-R1) is dimeric with no evidence for the presence of any trimer or tetramer (Fig. 10B). The equilibrium dissociation constant for the dimer, Kdimer, obtained by best fitting the modulation depth as a function of concentration (39) is ∼0.5 mM (Fig. 10C), only a factor of ∼2 higher than that obtained by AUC (Table 2), which is unsurprising since the sample is flash frozen and requires the presence of glycerol to prevent clustering of molecules during the freezing process. As an additional control, oxidation of Met7 to a sulfoxide (by mild treatment with H2O2) hugely reduces the DEER modulation depth (SI Appendix, Fig. S20), indicating that GB1-(Met7O)-httNTQ7 (S15C-R1) does not undergo self-association, fully consistent with the solution NMR data on (Met7O)-httNTQ7 (Fig. 2B).
Fig. 10.
Validation of the dimeric unit of the PRE-based structures of the httNTQ7 dimer by Q-band DEER EPR measurements on dimeric GB1-httNTQ7 (S15C-R1). (A) Q-band DEER echo curves (raw data in green; background-corrected curve in blue) recorded at 50 K on 2.2 mM GB1-httNTQ7 (S15C-R1) in 30% (vol/vol) glycerol. The black line represents the best-fit background represented by an exponential decay. The best-fit echo curve obtained by Tikhonov regularization (40) to generate the distance probability distribution, P(r), is shown in red, superimposed on the background-corrected experimental curve. (B) IM-DEER experiment showing the experimental (circles) normalized modulation depth Δ(θ)/Δmax as a function of ELDOR flip angle θ (where Δmax is the maximum modulation depth obtained at θ = 180°) together with the theoretical dependence for a dimer (red), trimer (blue) and tetramer (green). (C) Modulation depth as a function of concentration with the experimental data shown as red circles and the best-fit curve for a monomer–dimer association in blue. (D) Comparison of experimental P(r) distribution between S15C-R1 labels in the GB1-httNTQ7 dimer obtained by validated Tikhonov regularization (blue) with the average P(r) distribution predicted from the PRE-based structures with dimer-to-tetramer partitioning ranging from 0%:100% to 90%:10% (red). (E) Comparison of the mean distance between spin labels calculated for each ensemble of PRE-based structures (red circles) with the experimental mean distance obtained from DEER (blue thick line).
Deconvolution of the DEER echo curves for GB1-httNTQ7 (S15C-R1) obtained over a range of concentrations from 60 μM to 2.2 mM (SI Appendix, Fig. S21) using validated Tikhonov regularization (40) yields a P(r) distance distribution with a mean value of 26.5 Å, which compares very well with the average P(r) distribution calculated from the 10 lowest energy structures with dimer to tetramer partitioning ranging from 90%:10% to 0%:100% (Fig. 10D). When the mean intersubunit/intradimer S15C-R1/S15C-R1 distance is calculated for the 10 lowest energy structures within each ensemble obtained at the different dimer-to-tetramer ratios, it can be seen that the calculated mean distance ranges from 26.8 Å for the structures calculated with 100% and 80% tetramer, to 27.8 Å for those calculated with 70–90% dimer, in excellent agreement with the DEER results (Fig. 10E and SI Appendix, Fig. S22). For the ensemble calculated with 100% dimer, however, agreement is poor and the mean distance is considerably longer (30 Å), as expected since the helices in the 100% dimer structure ensemble are close to fully antiparallel.
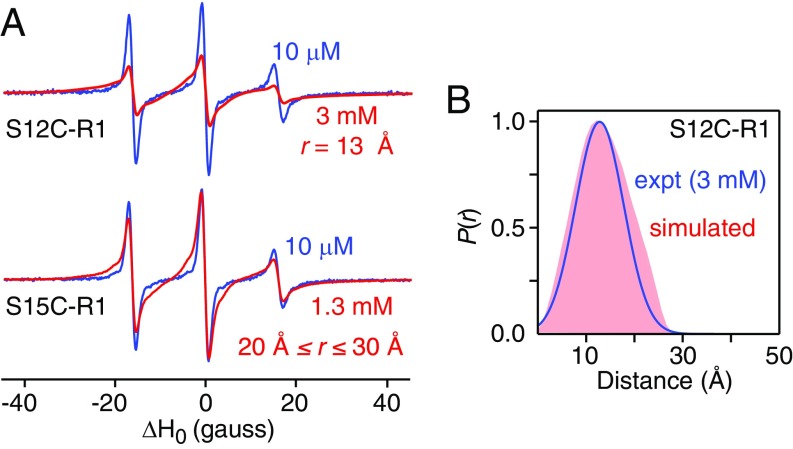
GB1-httNTQ7 (S12C-R1) is largely tetrameric as evidenced both by AUC (SI Appendix, Fig. S14) and from best fitting the DEER modulation depth as a function of concentration (Table 2). Unfortunately, DEER cannot be used to determine distances between S12C-R1 labels within the tetramer as the predicted intersubunit/intradimer distance is less than 15 Å, and hence the spins are in the strong dipolar coupling limit, beyond the range of applicability of DEER (26). Furthermore, the presence of a strongly coupled spin pair effectively precludes measurement of the longer interdimer distances in a multispin system. However, the short intersubunit/intradimer distance between S12C-R1 labels can be probed by CW EPR at room temperature by measuring line broadening arising from strong dipolar interactions between spins separated within a range of 8–20 Å (27). Comparison of the X-band EPR spectrum of monomeric GB1-httNTQ7 (S12C-R1) at low concentration (10 μM) with largely tetrameric GB1-httNTQ7 (S12C-R1) at high concentration (3 mM) reveals considerable line broadening corresponding to a mean distance of 13 Å (Fig. 11A) with a P(r) distribution [derived by quantitative analysis using the program ShortDistances (27)] that is in excellent agreement with that calculated from the PRE-based structures (Fig. 11B).
Fig. 11.
Validation of the dimeric unit of the PRE-based structures of the httNTQ7 dimer by X-band CW EPR measurements on dimeric GB1-httNTQ7 (S12C-R1) in solution. (A) Comparison of CW X-band EPR spectra of GB1-httNTQ7 (S12C-R1) (Top) and GB1-httNTQ7 (S15C-R1) (Bottom) at low (blue) and high (red) concentrations. The derivative EPR spectra are normalized to the double integral. At 10 μM, both samples are monomeric; at 3 mM, GB1-httNTQ7 (S12C-R1) is largely tetrameric (SI Appendix, Fig. S14); at 1.2 mM, GB1-httNTQ7 (S15C-R1) is largely dimeric (Fig. 9 and SI Appendix, Fig. S15). The broadening observed at the high concentration of GB1-httNTQ7 (S12C-R1) is due to strong dipolar coupling between closely spaced S12C-R1 labels within the dimeric unit of the tetramer and corresponds to a distance of 13 Å. (Note the interdimer distances between S12C-R1 labels in the PRE-based structure of the tetramer are too large to cause any significant line broadening of the CW EPR spectrum.) As a control, the high concentration GB1-httNTQ7 (S15C-R1) sample exhibits only minimal line broadening corresponding to a distance between 20 and 30 Å, fully consistent with the results from DEER EPR (Fig. 10). (B) Comparison of the experimental P(r) distance distribution between S12C-R1 labels (blue) derived from the CW EPR data using the program ShortDistances (27) with the corresponding intradimer average P(r) distribution calculated from the PRE-based structures with dimer-to-tetramer partitioning ranging from 0%:100% to 90%:10% (light red).
Concluding Remarks
The N-terminal httNT sequence plays a critical role in facilitating aggregation and fibril formation of poly(Q) tracts within the N-terminal domain of huntingtin, encoded by exon 1 of the huntingtin gene (41). While previous investigations established that the httNT sequence has helical propensity (18, 42–44), the initial events involved in httNT multimerization that eventually lead to polyglutamine fibril nucleation and the structures of the multimers were unknown. Using a minimalistic construct, httNTQ7, that remains predominantly monomeric over a sufficiently long period of time to enable detailed quantitative NMR measurements, but still eventually forms fibril, we were able to resolve at atomic resolution the early transient events in multimerization involving sparsely populated (<2%) oligomeric states, based on global analysis of the concentration dependence of an array of relaxation-based NMR measurements, including CPMG and R1p relaxation dispersion, transverse relaxation in the rotating frame, and exchange-induced chemical shifts.
The NMR data on httNTQ7 reveal the existence of a branching pathway, one path leading to a productive dimer followed by a tetramer on a timescale of 20–30 μs, and the other to a nonproductive dimer on an order of magnitude slower timescale (Fig. 5). Both dimers are very unstable with monomer–dimer equilibrium dissociation constants of 0.1–0.2 M, in contrast to the tetramer which is three to four orders of magnitude more stable with a dimer–tetramer equilibrium dissociation constant of ∼22 μM. The backbone chemical shifts derived for the minor species indicate that residues 3–17 of the httNT sequence form a contiguous helix in the productive dimer/tetramer with increasing disorder in the polyglutamine tail toward the C terminus (Fig. 7 A and B); the nonproductive dimer displays only partial helical character within the httNT sequence (Fig. 7B), presumably constituting an ensemble of states with multiple registers of the two subunits. Furthermore, we were able to characterize the structure of the productive dimer/tetramer using intermolecular PRE-measurements (Fig. 7C): the dimer is an antiparallel coiled coil, which assembles into a D2 symmetric tetramer constituted by a dimer of dimers oriented approximately orthogonal to one another (Figs. 8A and 9B). Packing between the subunits at the dimer (Fig. 9A) and dimer of dimers (Fig. 9B) interfaces is largely hydrophobic, and the structure of the tetramer is reminiscent of the arrangement of helices in the p53 tetramerization domain (37). Finally, the configuration of the dimer unit was independently validated from two interspin label distances measured by DEER (Fig. 9) and CW (Fig. 10) EPR.
The structure of the httNTQ7 tetramer explains the dependence of efficient fibril nucleation on poly(Q) length. The formation of a tetramer increases the local concentration of the poly(Q) tract, but for nucleation to occur polyglutamine chains from the different subunits must be able to overlap efficiently and fairly extensively. The distances between the C termini of the helices is ∼24 Å within the dimer, and ∼20 and ∼27 Å between dimers in the tetramer (corresponding to dark red/light red, dark red/light blue, and dark red/dark blue subunits, respectively, in Fig. 8A). The end-to-end distance of a disordered 10-residue poly(Q) sequence is predicted to lie between 20 and 25 Å (45), and the longer the poly(Q) tract, the higher the probability of significant interchain glutamine overlap. At pathological poly(Q) lengths (≥36), one can anticipate that nucleation through interchain glutamine contacts could be made between any pair of subunits, as opposed to the two subunit pairs with the shortest separation between httNT C-termini (that is the dark red/light blue and light red/dark blue subunit pairings in Fig. 8A).
Once fibrils are formed, it is uncertain whether stable structures of the httNT dimer or tetramer persist as solid-state NMR studies have shown that the static β-turn/β-strand fibril core is surrounded by dynamic, molten globule-like httNT helices (16). Thus, the initial transient oligomerization events described here that culminate in the formation of a tetramer of the httNT sequence constitute a prenucleation trigger or molecular switch that hugely increases the probability of occurrence of intermolecular poly(Q) contacts and hence poly(Q) fibril nucleation. One can speculate that CRISPR-directed mutation within the httNT sequence designed to prevent productive dimer and tetramer formation may provide a fruitful avenue for preventing or delaying the onset of Huntington’s disease.
Experimental Procedures
Full details relating to expression and purification of isotopically labeled samples, nitroxide spin labeling for NMR and EPR studies; NMR, EPR, AUC, and atomic force microscopy measurements; theory and global data fitting of relaxation dispersion and exchange-induced shift data; and PRE-based structure modeling are provided in SI Appendix.
Atomic coordinates of the tetramer, as well as experimental restraints, have been deposited in the Protein Data Bank (ID code 6N8C) (47), and backbone assignments for the tetramer have been deposited in the Biological Magnetic Resonance Data Bank (ID code 30545) (48).
Supplementary Material
Acknowledgments
We thank Nick Anthis for the design of the huntingtin exon-1 DNA constructs used in this work; Dusty Baber, Dan Garrett, and Jinfa Ying for technical assistance; and Attila Szabo for useful discussions. S.A.K. was supported by a Postdoctoral Research Associate Training Program Fellowship of the National Institute of General Medical Sciences (Fi2GM117609-01). This work was supported by the Intramural Program of the National Institute of Diabetes and Digestive and Kidney Diseases, National Institutes of Health (G.M.C.).
Footnotes
The authors declare no conflict of interest.
Data deposition: Atomic coordinates of the tetramer, as well as experimental restraints, have been deposited in the Protein Data Bank, www.wwpdb.org (PDB ID code 6N8C), and backbone assignments for the tetramer have been deposited in the Biological Magnetic Resonance Data Bank, www.bmrb.wisc.edu/ (BMRB ID code 30545).
This article contains supporting information online at www.pnas.org/lookup/suppl/doi:10.1073/pnas.1821216116/-/DCSupplemental.
References
- 1.Orr HT, Zoghbi HY. Trinucleotide repeat disorders. Annu Rev Neurosci. 2007;30:575–621. doi: 10.1146/annurev.neuro.29.051605.113042. [DOI] [PubMed] [Google Scholar]
- 2.Zuccato C, Valenza M, Cattaneo E. Molecular mechanisms and potential therapeutical targets in Huntington’s disease. Physiol Rev. 2010;90:905–981. doi: 10.1152/physrev.00041.2009. [DOI] [PubMed] [Google Scholar]
- 3.Bates GP, et al. Huntington disease. Nat Rev Dis Primers. 2015;1:15005. doi: 10.1038/nrdp.2015.5. [DOI] [PubMed] [Google Scholar]
- 4.Landles C, et al. Proteolysis of mutant huntingtin produces an exon 1 fragment that accumulates as an aggregated protein in neuronal nuclei in Huntington disease. J Biol Chem. 2010;285:8808–8823. doi: 10.1074/jbc.M109.075028. [DOI] [PMC free article] [PubMed] [Google Scholar]
- 5.Sathasivam K, et al. Aberrant splicing of HTT generates the pathogenic exon 1 protein in Huntington disease. Proc Natl Acad Sci USA. 2013;110:2366–2370. doi: 10.1073/pnas.1221891110. [DOI] [PMC free article] [PubMed] [Google Scholar]
- 6.Saudou F, Humbert S. The biology of Huntingtin. Neuron. 2016;89:910–926. doi: 10.1016/j.neuron.2016.02.003. [DOI] [PubMed] [Google Scholar]
- 7.Kar K, Jayaraman M, Sahoo B, Kodali R, Wetzel R. Critical nucleus size for disease-related polyglutamine aggregation is repeat-length dependent. Nat Struct Mol Biol. 2011;18:328–336. doi: 10.1038/nsmb.1992. [DOI] [PMC free article] [PubMed] [Google Scholar]
- 8.Ramdzan YM, et al. Huntingtin inclusions trigger cellular quiescence, deactivate apoptosis, and lead to delayed necrosis. Cell Rep. 2017;19:919–927. doi: 10.1016/j.celrep.2017.04.029. [DOI] [PubMed] [Google Scholar]
- 9.Crick SL, Ruff KM, Garai K, Frieden C, Pappu RV. Unmasking the roles of N- and C-terminal flanking sequences from exon 1 of huntingtin as modulators of polyglutamine aggregation. Proc Natl Acad Sci USA. 2013;110:20075–20080. doi: 10.1073/pnas.1320626110. [DOI] [PMC free article] [PubMed] [Google Scholar]
- 10.Shen K, et al. Control of the structural landscape and neuronal proteotoxicity of mutant Huntingtin by domains flanking the polyQ tract. eLife. 2016;5:e18065. doi: 10.7554/eLife.18065. [DOI] [PMC free article] [PubMed] [Google Scholar]
- 11.Schneider R, et al. Structural characterization of polyglutamine fibrils by solid-state NMR spectroscopy. J Mol Biol. 2011;412:121–136. doi: 10.1016/j.jmb.2011.06.045. [DOI] [PubMed] [Google Scholar]
- 12.Isas JM, Langen R, Siemer AB. Solid-state nuclear magnetic resonance on the static and dynamic domains of Huntingtin exon-1 fibrils. Biochemistry. 2015;54:3942–3949. doi: 10.1021/acs.biochem.5b00281. [DOI] [PMC free article] [PubMed] [Google Scholar]
- 13.Hoop CL, et al. Huntingtin exon 1 fibrils feature an interdigitated β-hairpin-based polyglutamine core. Proc Natl Acad Sci USA. 2016;113:1546–1551. doi: 10.1073/pnas.1521933113. [DOI] [PMC free article] [PubMed] [Google Scholar]
- 14.Sivanandam VN, et al. The aggregation-enhancing huntingtin N-terminus is helical in amyloid fibrils. J Am Chem Soc. 2011;133:4558–4566. doi: 10.1021/ja110715f. [DOI] [PMC free article] [PubMed] [Google Scholar]
- 15.Hoop CL, et al. Polyglutamine amyloid core boundaries and flanking domain dynamics in huntingtin fragment fibrils determined by solid-state nuclear magnetic resonance. Biochemistry. 2014;53:6653–6666. doi: 10.1021/bi501010q. [DOI] [PMC free article] [PubMed] [Google Scholar]
- 16.Lin H-K, et al. Fibril polymorphism affects immobilized non-amyloid flanking domains of huntingtin exon1 rather than its polyglutamine core. Nat Commun. 2017;8:15462. doi: 10.1038/ncomms15462. [DOI] [PMC free article] [PubMed] [Google Scholar]
- 17.Fiumara F, Fioriti L, Kandel ER, Hendrickson WA. Essential role of coiled coils for aggregation and activity of Q/N-rich prions and PolyQ proteins. Cell. 2010;143:1121–1135. doi: 10.1016/j.cell.2010.11.042. [DOI] [PMC free article] [PubMed] [Google Scholar]
- 18.Wetzel R. Physical chemistry of polyglutamine: Intriguing tales of a monotonous sequence. J Mol Biol. 2012;421:466–490. doi: 10.1016/j.jmb.2012.01.030. [DOI] [PMC free article] [PubMed] [Google Scholar]
- 19.Jayaraman M, et al. Slow amyloid nucleation via α-helix-rich oligomeric intermediates in short polyglutamine-containing huntingtin fragments. J Mol Biol. 2012;415:881–899. doi: 10.1016/j.jmb.2011.12.010. [DOI] [PMC free article] [PubMed] [Google Scholar]
- 20.Palmer AG., 3rd NMR characterization of the dynamics of biomacromolecules. Chem Rev. 2004;104:3623–3640. doi: 10.1021/cr030413t. [DOI] [PubMed] [Google Scholar]
- 21.Mittermaier A, Kay LE. New tools provide new insights in NMR studies of protein dynamics. Science. 2006;312:224–228. doi: 10.1126/science.1124964. [DOI] [PubMed] [Google Scholar]
- 22.Palmer AG, 3rd, Massi F. Characterization of the dynamics of biomacromolecules using rotating-frame spin relaxation NMR spectroscopy. Chem Rev. 2006;106:1700–1719. doi: 10.1021/cr0404287. [DOI] [PubMed] [Google Scholar]
- 23.Vallurupalli P, Bouvignies G, Kay LE. Increasing the exchange time-scale that can be probed by CPMG relaxation dispersion NMR. J Phys Chem B. 2011;115:14891–14900. doi: 10.1021/jp209610v. [DOI] [PubMed] [Google Scholar]
- 24.Iwahara J, Tang C, Marius Clore G. Practical aspects of 1H transverse paramagnetic relaxation enhancement measurements on macromolecules. J Magn Reson. 2007;184:185–195. doi: 10.1016/j.jmr.2006.10.003. [DOI] [PMC free article] [PubMed] [Google Scholar]
- 25.Clore GM, Iwahara J. Theory, practice, and applications of paramagnetic relaxation enhancement for the characterization of transient low-population states of biological macromolecules and their complexes. Chem Rev. 2009;109:4108–4139. doi: 10.1021/cr900033p. [DOI] [PMC free article] [PubMed] [Google Scholar]
- 26.Jeschke G. DEER distance measurements on proteins. Annu Rev Phys Chem. 2012;63:419–446. doi: 10.1146/annurev-physchem-032511-143716. [DOI] [PubMed] [Google Scholar]
- 27.Altenbach C, López CJ, Hideg K, Hubbell WL. Exploring structure, dynamics, and topology of nitroxide spin-labeled proteins using continuous-wave electron paramagnetic resonance spectroscopy. Methods Enzymol. 2015;564:59–100. doi: 10.1016/bs.mie.2015.08.006. [DOI] [PubMed] [Google Scholar]
- 28.Aiken CT, et al. Phosphorylation of threonine 3: Implications for Huntingtin aggregation and neurotoxicity. J Biol Chem. 2009;284:29427–29436. doi: 10.1074/jbc.M109.013193. [DOI] [PMC free article] [PubMed] [Google Scholar]
- 29.Anthis NJ, Clore GM. Visualizing transient dark states by NMR spectroscopy. Q Rev Biophys. 2015;48:35–116. doi: 10.1017/S0033583514000122. [DOI] [PMC free article] [PubMed] [Google Scholar]
- 30.Fawzi NL, Ying J, Ghirlando R, Torchia DA, Clore GM. Atomic-resolution dynamics on the surface of amyloid-β protofibrils probed by solution NMR. Nature. 2011;480:268–272. doi: 10.1038/nature10577. [DOI] [PMC free article] [PubMed] [Google Scholar]
- 31.McConnell HM. Reaction rates by nuclear magnetic resonance. J Chem Phys. 1958;28:430–431. [Google Scholar]
- 32.Rennella E, Sekhar A, Kay LE. Self-assembly of human Profilin-1 detected by Carr–Purcell–Meiboom–Gill nuclear magnetic resonance (CPMG NMR) spectroscopy. Biochemistry. 2017;56:692–703. doi: 10.1021/acs.biochem.6b01263. [DOI] [PubMed] [Google Scholar]
- 33.Shen Y, Delaglio F, Cornilescu G, Bax A. TALOS+: A hybrid method for predicting protein backbone torsion angles from NMR chemical shifts. J Biomol NMR. 2009;44:213–223. doi: 10.1007/s10858-009-9333-z. [DOI] [PMC free article] [PubMed] [Google Scholar]
- 34.Shen Y, Bax A. Protein structural information derived from NMR chemical shift with the neural network program TALOS-N. Methods Mol Biol. 2015;1260:17–32. doi: 10.1007/978-1-4939-2239-0_2. [DOI] [PMC free article] [PubMed] [Google Scholar]
- 35.Schwieters CD, Kuszewski JJ, Clore GM. Using Xplor-NIH for NMR molecular structure determination. Prog Nucl Magn Reson Spectrosc. 2006;48:47–62. [Google Scholar]
- 36.Schwieters CD, Bermejo GA, Clore GM. Xplor-NIH for molecular structure determination from NMR and other data sources. Protein Sci. 2018;27:26–40. doi: 10.1002/pro.3248. [DOI] [PMC free article] [PubMed] [Google Scholar]
- 37.Clore GM, et al. Refined solution structure of the oligomerization domain of the tumour suppressor p53. Nat Struct Biol. 1995;2:321–333. doi: 10.1038/nsb0495-321. [DOI] [PubMed] [Google Scholar]
- 38.Schmidt T, Ghirlando R, Baber J, Clore GM. Quantitative resolution of monomer-dimer populations by inversion modulated DEER EPR spectroscopy. ChemPhysChem. 2016;17:2987–2991. doi: 10.1002/cphc.201600726. [DOI] [PMC free article] [PubMed] [Google Scholar]
- 39.Ceccon A, et al. Interaction of Huntingtin exon-1 peptides withl lipid-based micellar nanoparticles probed by solution NMR and Q-band pulsed EPR. J Am Chem Soc. 2018;140:6199–6202. doi: 10.1021/jacs.8b02619. [DOI] [PMC free article] [PubMed] [Google Scholar]
- 40.Jeschke G, et al. DeerAnalysis2006–A comprehensive software package for analyzing pulsed ELDOR data. Appl Magn Reson. 2006;30:473–498. [Google Scholar]
- 41.Arndt JR, Chaibva M, Legleiter J. The emerging role of the first 17 amino acids of huntingtin in Huntington’s disease. Biomol Concepts. 2015;6:33–46. doi: 10.1515/bmc-2015-0001. [DOI] [PMC free article] [PubMed] [Google Scholar]
- 42.Baias M, et al. Structure and dynamics of the Huntingtin exon-1 N-terminus: A solution NMR perspective. J Am Chem Soc. 2017;139:1168–1176. doi: 10.1021/jacs.6b10893. [DOI] [PubMed] [Google Scholar]
- 43.Pandey NK, et al. The 17-residue-long N terminus in huntingtin controls stepwise aggregation in solution and on membranes via different mechanisms. J Biol Chem. 2018;293:2597–2605. doi: 10.1074/jbc.M117.813667. [DOI] [PMC free article] [PubMed] [Google Scholar]
- 44.Bravo-Arredondo JM, et al. The folding equilibrium of huntingtin exon 1 monomer depends on its polyglutamine tract. J Biol Chem. 2018;293:19613–19623. doi: 10.1074/jbc.RA118.004808. [DOI] [PMC free article] [PubMed] [Google Scholar]
- 45.Cantor CR, Schimmel PR. Biophysical Chemistry Part III: The Behavior of Biological Macromolcules. Freeman; San Francisco: 1980. [Google Scholar]
- 46.Iwahara J, Schwieters CD, Clore GM. Ensemble approach for NMR structure refinement against 1H paramagnetic relaxation enhancement data arising from a flexible paramagnetic group attached to a macromolecule. J Am Chem Soc. 2004;126:5879–5896. doi: 10.1021/ja031580d. [DOI] [PubMed] [Google Scholar]
- 47.Kotler SA, et al. 2018 Structure of the Huttingtin tetramer/dimer mixture determined by paramagnetic NMR. Protein Data Bank. Available at https://www.rcsb.org/structure/6N8C. Deposited November 30, 2018.
- 48.Kotler SA, et al. 2018 Structure of the Huttingtin tetramer/dimer mixture determined by paramagnetic NMR. Biological Magnetic Resonance Data Bank. Available at http://www.bmrb.wisc.edu/data_library/summary/index.php?bmrbId=30545. Deposited December 6, 2018.
Associated Data
This section collects any data citations, data availability statements, or supplementary materials included in this article.


