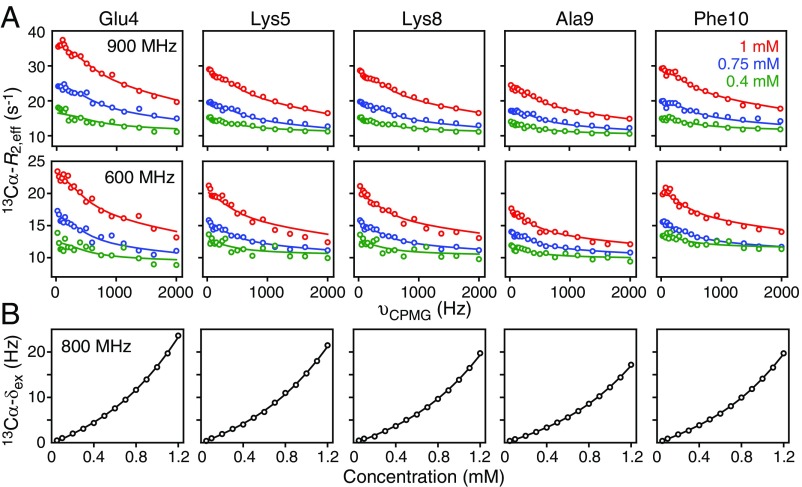
Fig. 3.
Quantitative analysis of the concentration dependence of 13Cα CPMG relaxation dispersion profiles and 13Cα exchange-induced shifts for httNTQ7. Representative (A) 13Cα CPMG relaxation dispersion profiles at 900 MHz (Top) and 600 MHz (Bottom), and (B) 13Cα exchange-induced chemical shifts (δex) at 800 MHz. The experimental data, recorded at 5 °C, are shown as circles. The best-fit curves from a global fit to the kinetic model shown in Fig. 5 are represented by the continuous lines. The CPMG relaxation dispersion data were recorded on a 13Cα/15N-labeled sample, while the exchange-induced shift data were recorded on a uniformly 13C/15N-labeled sample.

