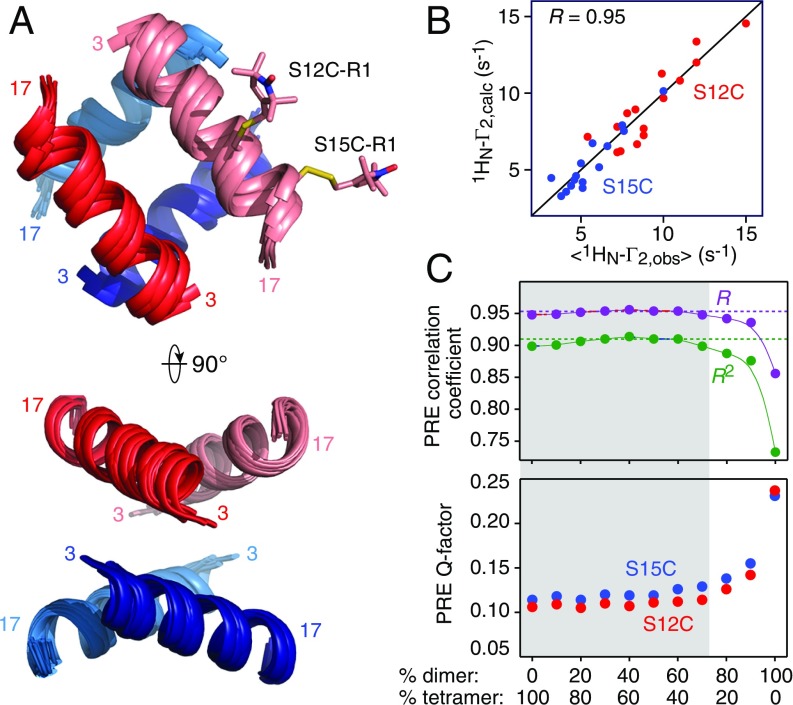
Fig. 8.
PRE-based structure of the httNTQ7 tetramer. (A) Two orthogonal views showing ribbon diagrams of a superposition of the lowest energy, PRE-based structures from each ensemble calculated with dimer to tetramer partitioning ranging from 0%:100% to 90%:10%. The tetramer is a dimer of dimers, and the structure of the dimer (one shown in red and pink, and the other in blue and light blue) is assumed to be the same in the dimer and tetramer. The helix that extends from residues 3–17 is treated as a rigid body. (B) Correlation between observed and calculated PREs. The latter are the average of the calculated values of the lowest energy structures from each ensemble computed with dimer:tetramer populations ranging from 0%:100% to 90%:10%. The Pearson correlation coefficient R has a value of 0.95. Equivalent plots for the individual ensembles calculated at the different dimer-to-tetramer ratios are shown in SI Appendix, Fig. S18. (C) Plot of PRE correlation coefficient (Top, with R and R2 shown in purple and green, respectively) and PRE Q factor (Bottom, with the values for S12C-R1 and S15C-R1 shown in red and blue, respectively) as a function of dimer-to-tetramer partitioning (1 SD error bars lie within the circles). The PRE Q factor is given by (46). The gray shaded area indicates the likely range of partitioning of dimer-to-tetramer populations. The structures calculated with 100% dimer do not satisfy the experimental PRE data; the structures calculated with 80% and 90% dimer exhibit some degradation in agreement with the PRE data (as measured both by the correlation coefficient and the Q factor), although they are structurally very similar to the structures calculated with lower dimer populations.

