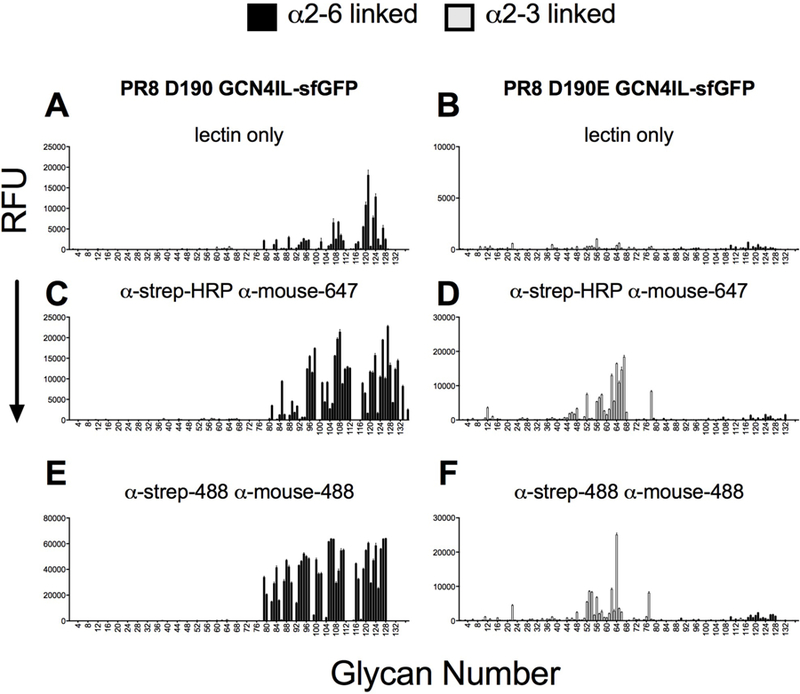
Figure 4. Receptor specificity of PR8 D190 and D190E GCN4IL-sfGFP.

(A) PR8 D190 without precomplexing (B) PR8D190E without precomplexing (C) PR8 D190 precomplexed with α-strep-HRP and α-mouse-647 (D) PR8 D190E precomplexed with α-strep-HRP and α-mouse-647 (E) PR8 CAM precomplexed with α-Strep-488 and α-Mouse-488 (F) PR8 D190E precomplexed with α-Strep-488 and α-Mouse-488. The mean signal and standard error were calculated from six independent replicates of glycans printed on the array. The data shown is a representative of three independent assays. α2–3 linked sialosides are shown in white bars (glycans 11 to 77 on the x axis) and α2–6 linked sialosides in black (glycans 78 to 130). Glycans 1 to 10 are non-sialylated controls (see also Table S1)
