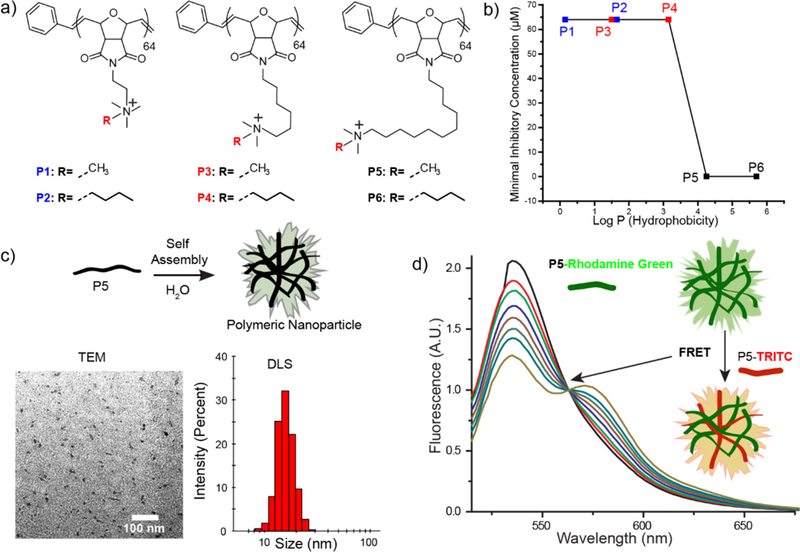
Figure 1.

Molecular structures of a) oxanorbornene polymer derivatives. b) MIC values of polymer derivatives with different hydrophobic chain lengths. Log P represents the calculated hydrophobic values of each monomer c) Schematic representation depicting self-assembly of P5-homopolymers. Characterization of P5 PNPs using TEM imaging and DLS measurement. d) Graph for FRET experiments between P5-Rhodamine Green and P5-TRITC indicating formation of polymeric NPs.
