Figure 5.

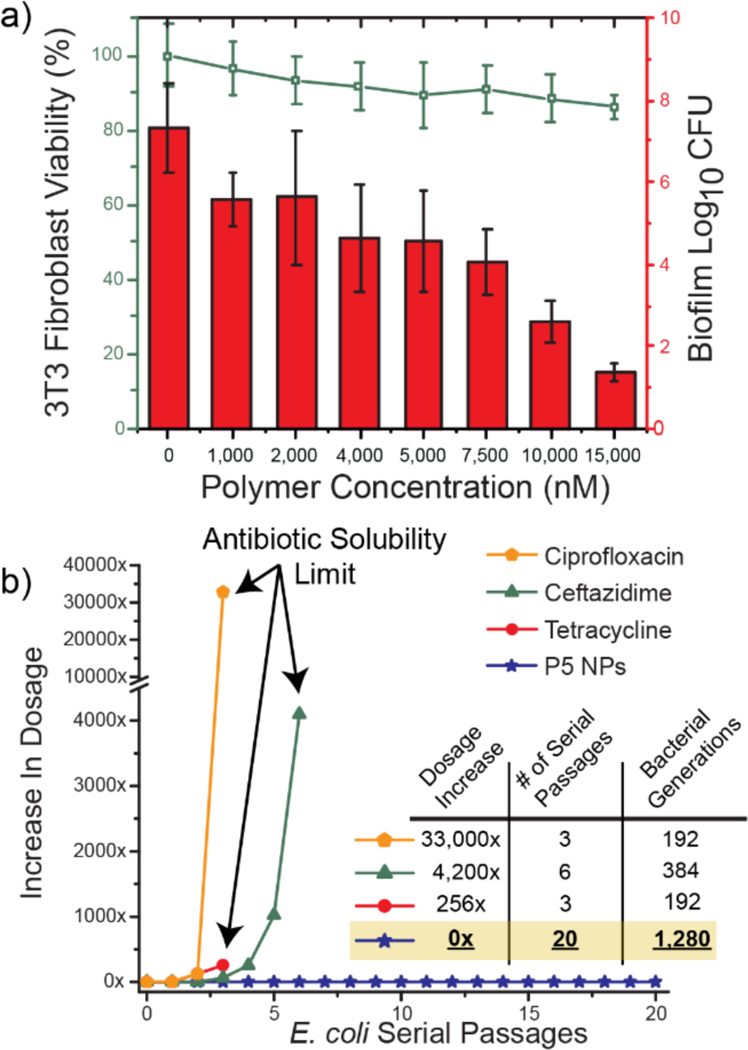
a) Viability of 3T3 fibroblast cells and E. coli biofilms in the co-culture model after 3 h treatment with P5 PNPs. Scatters and lines represent 3T3 fibroblast cell viability. Bars represent log10 of colony forming units in biofilms. The data are average of triplicates and the error bars indicate the standard deviations. b) Resistance development during serial passaging in the presence of sub-MIC levels of antimicrobials. The y axis is the highest concentration the cells grew in during passaging. The figure is representative of 3 independent experiments.
