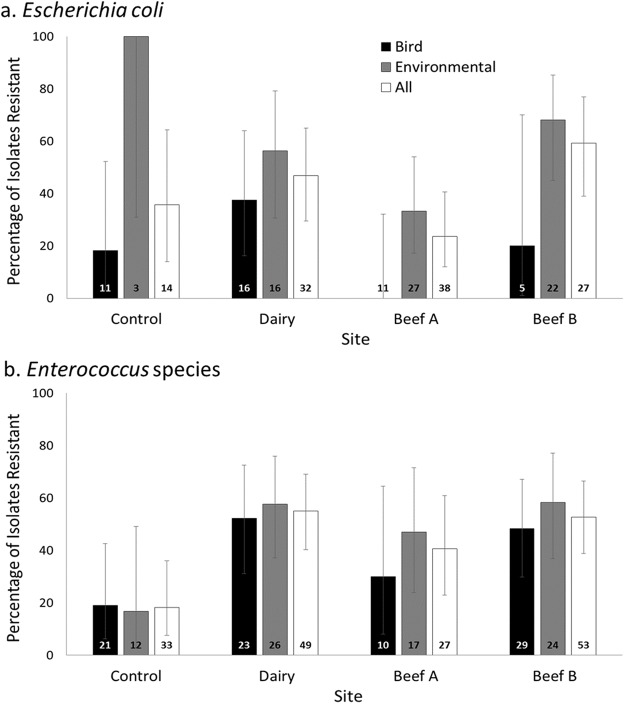
Figure 1. Prevalence of antimicrobial resistance by site, bacterial genus, and isolate source.
Percentage (±95% CI of proportions; total n for each group provided at bar bases) of Escherichia coli (A) and Enterococcus (B) isolates resistant to one or more antimicrobial drug at a residential control and three cattle farm sites in central Illinois by sample source. The total proportions of Escherichia coli isolates resistant to one or more antimicrobial drug at each farm site did not differ significantly from the Control (Pairwise comparisons with Control as referent: all p > 0.05). Enterococcus isolates from the farm sites has significantly higher proportions of resistant isolates for two of three sites (Fisher’s exact, pair-wise comparisons with Control as referent: Dairy p = 0.001, Beef A p = 0.080, Beef B p = 0.0002).

