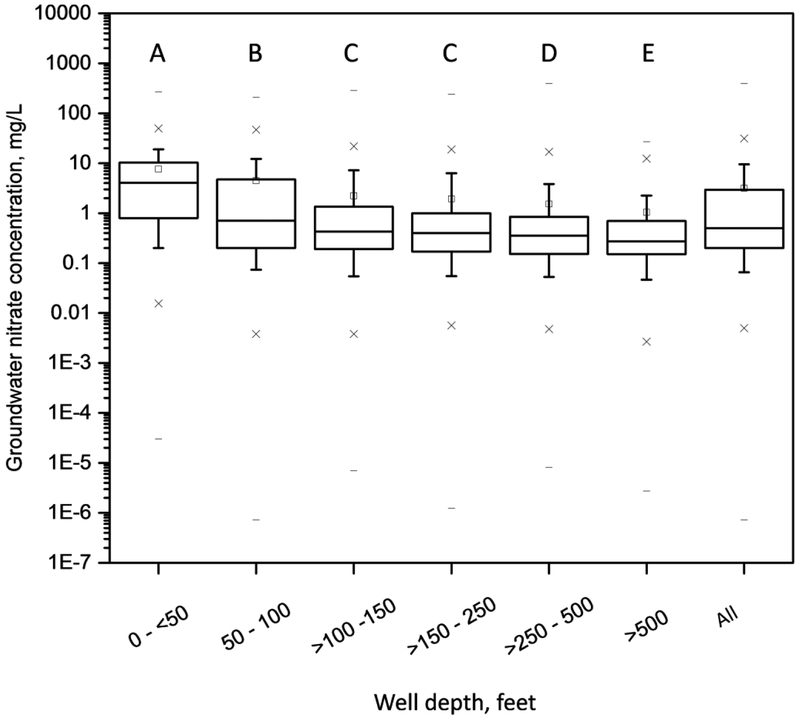
Figure 1.
Box plots of groundwater nitrate concentration by well-depth category, and for all well depths, for training and testing data subsets combined; whiskers indicate the 10th and 90th percentiles, “–” is minimum or maximum nitrate concentration, “x” is the 1st or 99th percentile concentration, and “□” is the mean concentration. Boxes with the same letter are not significantly different according to the Tukey HSD (honest significant difference) test applied to ranked data.

