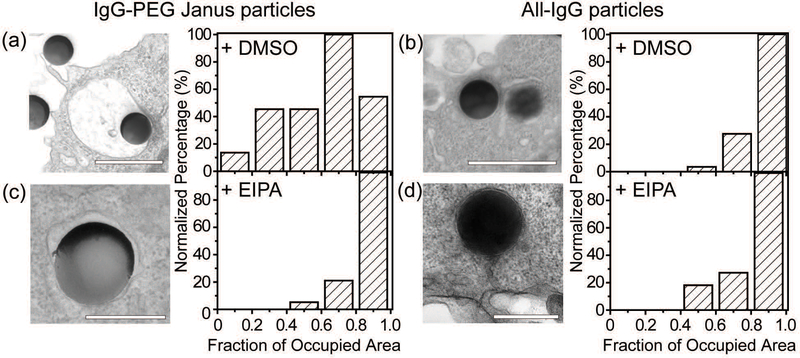
Fig. 4.
Quantification of tightness of phagosomes. (a) and (c) are for 500 nm IgG–PEG Janus particles in DMSO-treated (a) and EIPA-treated macrophages (c). (b) and (d) are for 500 nm all-IgG control particles in DMSO-treated (b) and EIPA-treated macrophages (d). All bar graphs show the distribution of phagosome areas occupied by single particles. The fraction of occupied area is 0.60 ± 0.03 (average ± SEM) for (a), 0.84 ± 0.02 for (b), 0.87 ± 0.02 for (c) and 0.80 ± 0.03 for (d). A total of N = 57 particles were analyzed for (a), N = 38 for (b), N = 24 for (c) and N = 16 for (d). Scale bars: 1 μm in (a) and (b), and 500 nm in (c) and (d).

