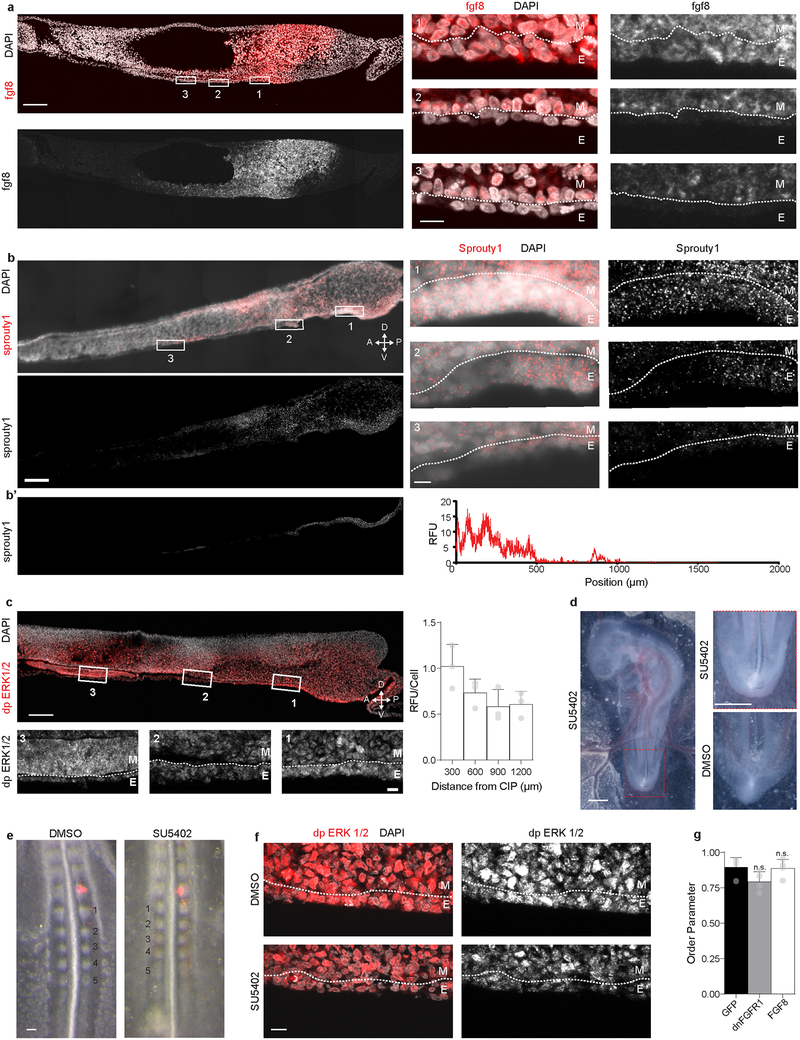
Extended Data Fig. 6. FGF signaling in the posterior endoderm.
a – b, Fluorescent section in situ hybridization for fgf8 (a), and sprouty1 (b) in sagittal sections through the posterior HH15 embryo (left); numbered boxes indicate magnified images at right; dashed line demarcates boundary between endoderm (E) and mesoderm (M). Scale bars 100 μm at left, and 10 μm in the magnified images at right; gradient expression of both genes observed in n = 3/3 embryos. b’, Isolated signal from endoderm only (left) and quantification of relative fluorescence (right). c, Immunofluorescent detection of di-phospho ERK (dp ERK) 1/2 with boxed regions magnified below; dashed line marks boundary between endoderm (E) and mesoderm (M). Scale 100 μm (top) and 10 μm (bottom). At right, quantification of dp ERK 1/2 per cell along the antero-posterior axis (n = 3 embryos); RFU = relative fluorescent units. d, Embryos cultured in the presence of 50 μM SU5402 from HH14 to HH18 (left), magnified at right (top), displayed normal anterior development, but posterior defects, including axis truncation, allantois malformation, and failure of the posterior endoderm to internalize and form hindgut; compared to 0.1% DMSO control (bottom); n = 7/9 affected vs. 0/10 in 0.1% DMSO. Scale = 1 mm. e, Somitogenesis unaffected by 50 μM SU5402 exposure in EC culture, despite dependence of this process on FGF signaling, suggests effects of SU5402 were primarily restricted to the endoderm. HH13 embryos cultured for 9 hours in the presence of either 0.1% DMSO or 50 μM SU5402 following Di I injection into the last formed somite (red) at the time of exposure (n = 3). Scale bar = 100 μm. f, dp ERK 1/2 staining in the posterior endoderm following incubation of embryos from HH13 to HH15 in the presence of either 0.1% DMSO (top, n = 3) or 50 μM SU5402 (bottom, n = 3); effects of SU5402 were most pronounced in endoderm, with some subtle reduction in dp ERK ½ extending into the subadjacent mesodermal cells. White dashed line indicates boundary between endoderm (E) and mesoderm (M). Scale 10 μm. g, Quantification of order parameter for embryos electroporated with GFP, dnFGFR1 IRES GFP, or FGF8 IRES GFP (n = 4 embryos per condition); mean ± s.d., 1-way ANOVA with Tukey’s correction; n.s. = not significant vs. GFP.

