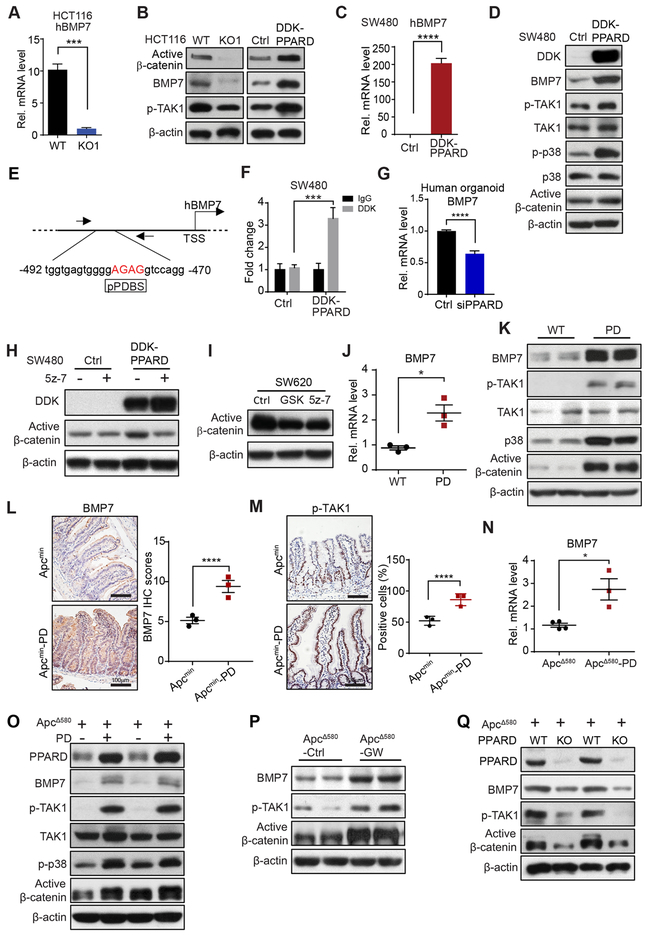
Figure 3.
PPARD activates BMP7/TAK1/β-catenin signaling in IECs. A, BMP7 mRNA expression levels in HCT116 WT or KO1 cells. B, Protein expression of BMP7, phosphorylated TAK1 (p-TAK1) in HCT116 WT or KO1 cells or HCT116 cells stably transduced with Ctrl or DDK-PPARD as described in Figure 1G. C, BMP7 mRNA expression levels in SW480 cells stably transduced with Ctrl or DDK-PPARD. D, Expression levels of BMP7, p-TAK1, TAK1, phosphorylated-p38 (p-p38), p38, and active β-catenin in SW480 cells described in panel C. E, Schematic map of potential PPARD binding site (pPDBS) in the promoter of the human BMP7 gene according to Genomatix MatInspector online software. Nucleotides marked in red indicate core sequences. TSS: transcription start site. F, PPARD’s binding to pPDBS in the promoter of the human BMP7 gene, measured by chromatin immunoprecipitation-quantitative PCR (−492 to −470 bp of the BMP7 promoter) in SW480 cells described in panel C. G, BMP7 mRNA expression level in human CRC organoid cells transfected with Ctrl-siRNA or PPARD siRNA for 48 hours. H, Active β-catenin expression in SW480 cells described in panel C, treated with the specific TAK1 inhibitor 5z-7 (2.5 μM) or an equal amount of control solvent (DMSO) for 24 hours. I, Active β-catenin expression levels in SW620 cells treated with 5z-7 (2.5 μM), PPARD antagonist GSK3787 (GSK, 1 μM), or an equal amount of DMSO for 24 hours. J, BMP7 mRNA expression levels in IECs of PD mice and their WT littermates. K, Protein expression levels of the indicated genes in IECs of the mice described in panel J. L and M, Representative IHC images and IHC scores of BMP-7 (L) and p-TAK1 (M) expression in IECs of the Apcmin and Apcmin-PD mice at 8 weeks (n = 3 mice/group). IHC CES of BMP-7 and average percentage of positive IHC stained cells of p-TAK1 obtained from 20 glands were presented. N, BMP7 mRNA expression levels in IECs of ApcΔ580 and ApcΔ580-PD littermates. O, Protein expression levels of the indicated genes in IECs of the mice described in panel N. P, Protein expression levels of the indicated genes in IECs of ApcΔ580 mice treated with GW501516 or control diet as described in Figure 2F-H. Q, Protein expression levels of the indicated genes in IECs of ApcΔ580 and ApcΔ580-PD-KO mice. Data are shown as mean ± SEM. *P < 0.05, ***P < 0.001, and ****P < 0.0001.

