
Figure 1.
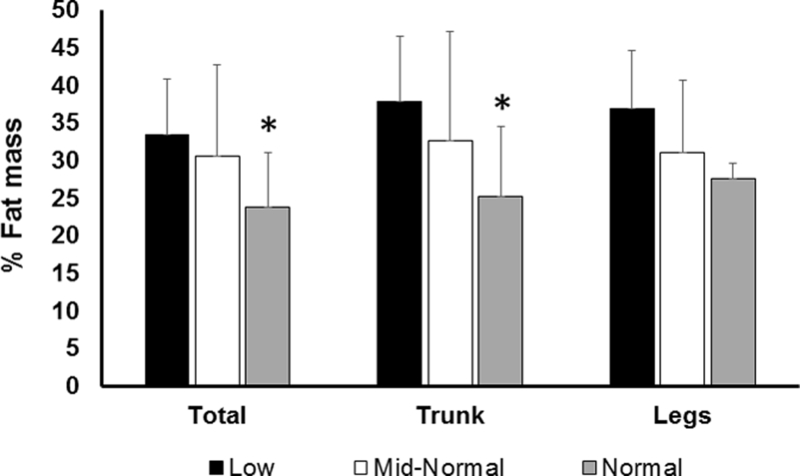
Mean total, trunk and leg percent fat as analyzed by DXA based on low, mid-normal and normal serum testosterone levels. *P< 0.05 versus T≤ 400ng/dL.
Official websites use .gov
A
.gov website belongs to an official
government organization in the United States.
Secure .gov websites use HTTPS
A lock (
) or https:// means you've safely
connected to the .gov website. Share sensitive
information only on official, secure websites.
Mean total, trunk and leg percent fat as analyzed by DXA based on low, mid-normal and normal serum testosterone levels. *P< 0.05 versus T≤ 400ng/dL.