
Figure 1.
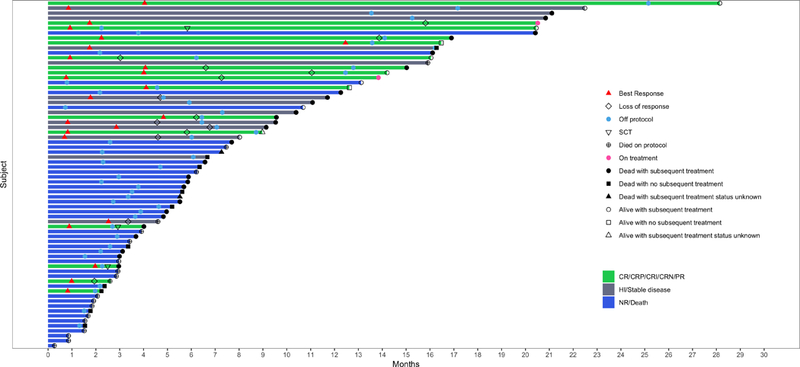
Swimmers plot illustrating the clinical course of study patients (N = 70). The best response, on or off study status, alive or dead status, and allogeneic stem cell status for the 70 patients enrolled on study is shown in this swimmers plot.