
Fig 1.
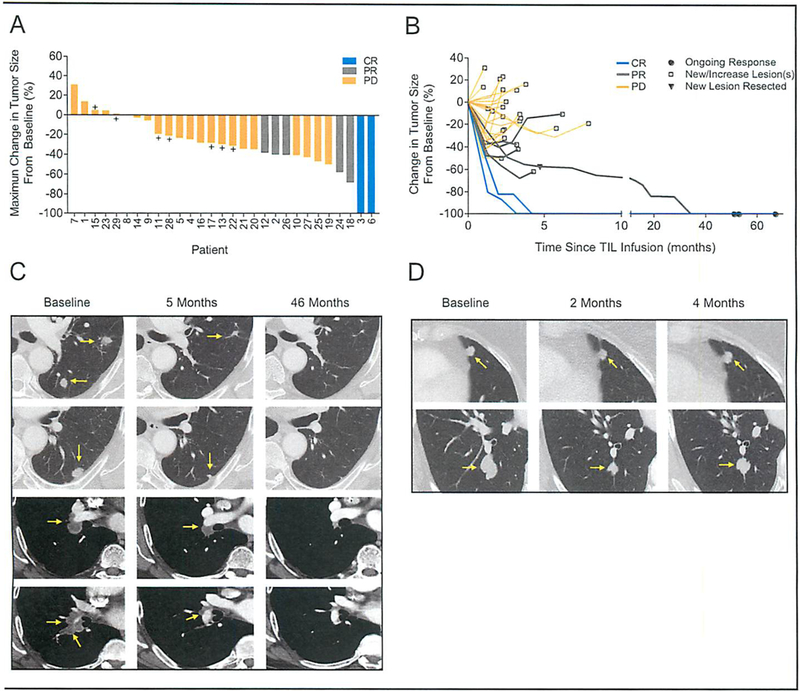
Clinical responses in patients after HPV-TIL therapy. (A) Waterfall plot of the maximum change in the sum of target lesions, as compared to baseline measurements, in 29 patients. CR, complete response; PR, partial response; PR, progressive disease; +, stable disease. (B) Spider plots of the change in the sum of target lesions from pretreatment baseline in 29 patients. Black circles (●) indicate ongoing responses, open squares (□) indicate progressive disease due to either a new lesion(s) or increasing target or non-target lesion(s). Black triangle (▼) indicates progressive disease in patient 24 with oropharyngeal cancer due to development of a new brain lesion after a PR of 5 months in duration. (C-D) Contrast-enhanced computed tomography scans obtained at baseline and after treatment for patient 24 with oropharyngeal cancer (C) and patient 26 with anal cancer (D). Tumors are marked by yellow arrows. Patient 24 had disease involving his left lung (first and second row) and mediastinum (third and fourth row). He experienced a PR of 5 months in duration due to a new brain lesion which was surgically excised. He was followed off-protocol, and his target lesions continued to regress, and there was no evidence of disease at most recent follow-up 51 months after treatment. Patient 26 had disease involving both lungs (first and second row). She experienced a PR of 4 months in duration due to increase in her target lesions.