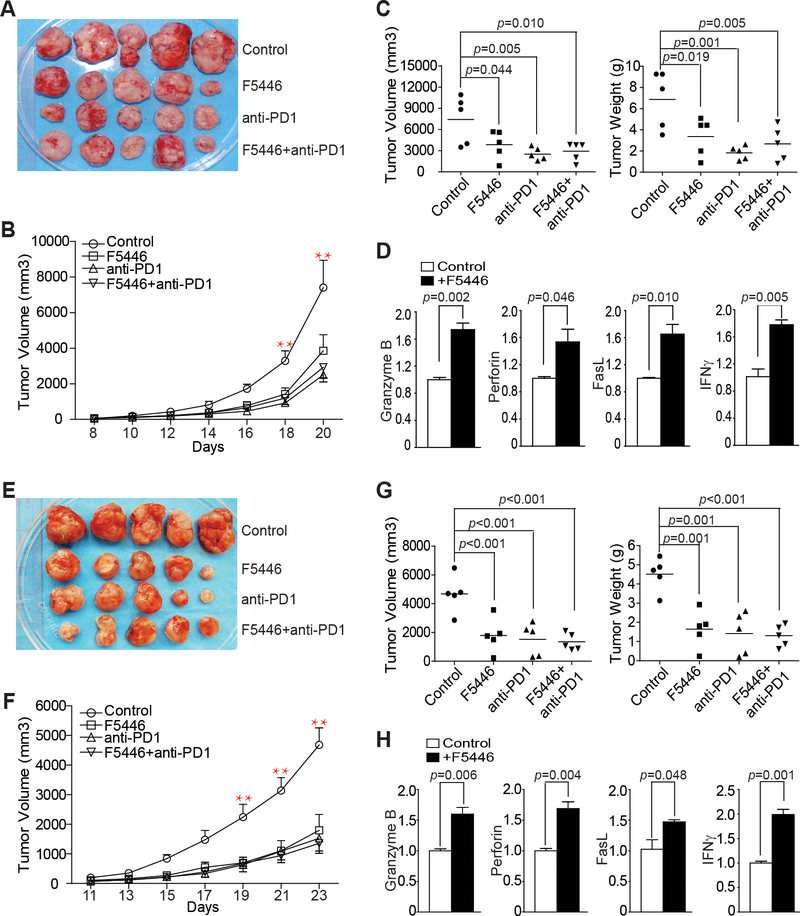
Figure 6. F5446 increases T-cell effector gene expression to suppress colon carcinoma growth in vivo.
A. MC38 cells (1.5×10⁵ cells/mouse) were injected to thirty C57BL/6 mice subcutaneously. Twenty mice with similar sized tumors were randomly assigned into four groups (n=5/group) at day 8 after tumor cell injection. The four groups of tumor-bearing mice were treated with vehicle and IgG (control), F5446 (10 mg/kg), anti-PD-1 (200 μg/mouse), and F5446+anti-PD-1 every two days for 14 days. Shown are tumor images. B. Tumor growth rates in control and treatment groups were measured as tumor volume over time. Differences in tumor volume between control and treatment groups were analyzed statistically as described in the methods. **p<0.01. Bar: SEM. C. Mice were sacrificed at day 22 after tumor cell injection. Tumors were dissected and measured for volume (left panel) and weight (right panel). Differences in tumor volume and weight between control and treatment groups were determined by two-tail t test with p<0.05 as being statistically significant. Bar: mean. D. RNA was prepared from the tumor tissues of the control and F5446 treatment groups. RNA from three mice in each group was pooled and analyzed by qPCR in triplicates for the expression of indicated T-cell effector genes. β-actin was used as an internal normalization control. Differences in each gene expression between control and the treatment groups were determined by two-tail t test with p<0.05 as being statistically significant. Column: mean; Bar, SEM. E. CT26 cells (2×10⁵ cells/mouse) were injected to thirty BALB/c mice subcutaneously. Twenty mice with similar sized tumors were randomly assigned into four groups and treated as in A. Shown are tumor images. F. Tumor growth rates in the control and treatment groups were measured as tumor volume over time and differences in tumor volume between control and treatment groups were determined statistically as described in methods.** p<0.01. Bar: SEM. G. Mice were sacrificed at day 24 after tumor cell injection. Tumors were dissected and measured for volume (left panel) and weight (right panel). Differences in tumor volume and weight between control and treatment groups were determined by two-tail t test. Bar: mean. H. RNA was prepared from total tumor tissues of the control and F5446 treatment groups. RNA from three mice in each group was pooled and analyzed by qPCR in triplicates for the expression of the indicated T-cell effector genes. β-actin was used as an internal normalization control. Differences in each gene expression between control and the treatment groups were determined by two-tail t test with p<0.05 as being statistically significant. Column: mean; Bar, SEM.

