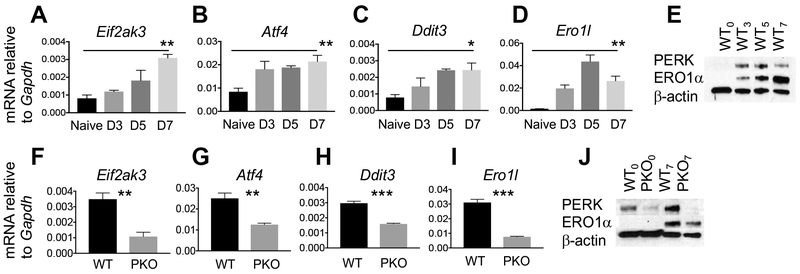
Figure 1. PERK contributes to chronic ER stress in C8+ T effector cells.
Naïve WT OT-1+ CD8+ T cells were activated and expanded with cognate peptide and harvested at indicated time points. (A-D) PERK (Eif2ak3), ATF4 (Atf4), CHOP (Ddit3), and ERO1α (Ero1l) gene expression were measured by qPCR and (E) PERK and ERO1α proteins measured by immunoblot (5μg, 2min). Data from 4 biological replicates are quantified and represented as SEM; results from students t test performed for naïve versus day 7 T cells are displayed. Experiments were repeated with four different WT animals and immunoblot is representative. Naïve PERK KO (OT-1xLck-Cre+xPERKf/f) and littermate controls (OT-1xLck-Cre−xPERKf/f) or 7-day expanded T cells were harvested. (F-I) PERK (Eif2ak3), ATF4 (Atf4), CHOP (Ddit3), and ERO1α (Ero1l) gene expression measured by qPCR and (J) immunblot (5μg, 1min) for PERK and ERO1α proteins. PERK 8min exposure is shown to convey lack of protein expression. Data from three WT and littermate pairs are quantified and represented as SEM, students t test. Experiments repeated twice and immunoblot data are representative of four independent experiments. *p<0.05, **p<0.01, ***p<0.001.

