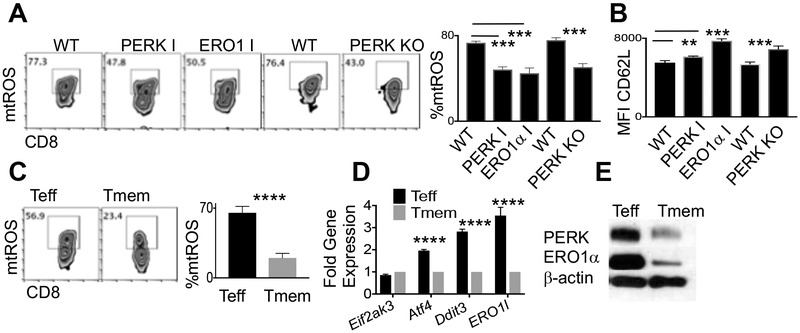
Figure 4. PERK axis drives mitochondrial exhaustion and is impaired in memory T cells.
Representative FACS plots and quantification of day 7 WT, PERK I, ERO1 I-treated and WT (littermate) and PERK KO OT-1+ CD8+ T cells probed for (A) mtROS or (B) CD62L expression. Bar graphs from 4 biological replicates are quantified and represented as SEM, Students t test performed for each condition versus control. FACS gates are set from fluorescence minus one controls. Experiments were repeated at least three times. T effector (Teff) or memory (Tmem) cells were developed and harvested. (C) Representative FACS plot and quantification of mtROS expression (D) quantification of PERK (Eif2ak3), ATF4 (Atf4), CHOP (Ddit3), and ERO1α (Ero1l) gene and (E) immunoblot for PERK and ERO1α proteins. FACS quantification from four biological replicates. Experiment repeated 3 times. Gene expression bar graphs represent average of 3 separate experiments and are shown as SEM, Teff values are expressed relative to respective Tmem values set to 1. Immunoblot is representative data from 3 experiments. **p<0.01, ***p<0.001, ****p<0.0001.

