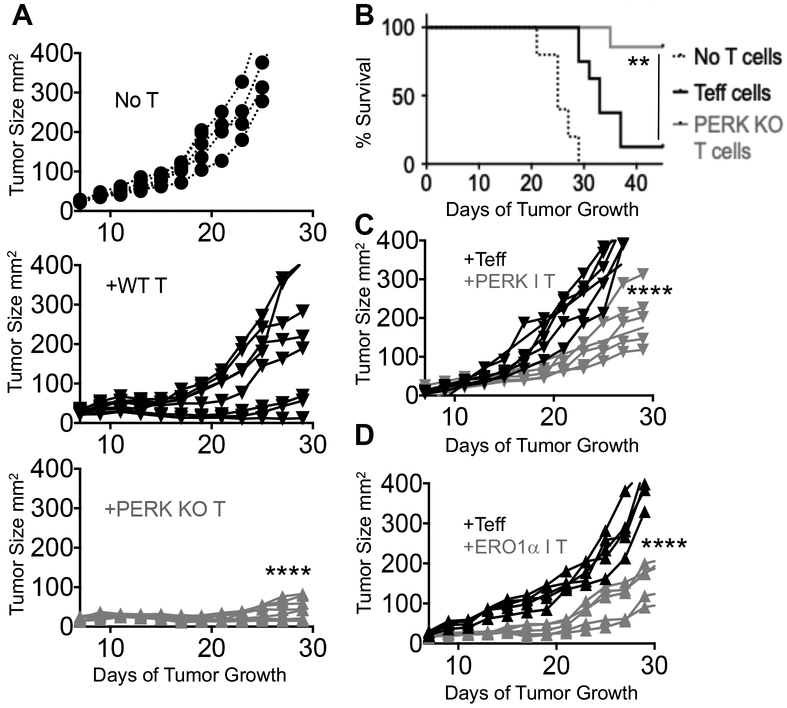
Figure 5. Inhibition of PERK axis augments T cell-specific tumor control.
(A) Individual graphs of mice bearing 7-day B16F1-OVA tumors left untreated (n=5) or treated intravenously with 5×10⁵ 7-day expanded OT-1+ (Teff) (n=8) or PERK KO (n=7) T cells. Tumor size recorded every other day for 3 weeks. Lines represent individual mice. (B) Survival to 45 days or tumor size of 400mm2 was recorded, Log-rank test, **p<0.01 survival proportions of mice treated with Teff (12%) versus PERK KO T cells (86%) (C) Mice bearing 7-day B16F10 melanomas were treated intravenously with 2×10⁶ 7-day expanded Pmel (Teff) or Pmel T cells developed in the presence of (B) PERK inhibitor (PERK I T) or (D) ERO1α inhibitor (ERO1α I T). Tumor size recorded every other day for 3 weeks. Lines represent individual mice. Linear regression of Teff versus PERK KO or inhibitor-treated T cell groups, n=5-6 mice per group, ****p<0.0001. Experiments repeated twice.

