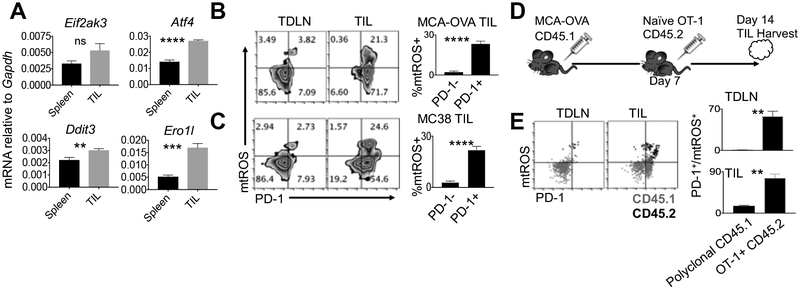
Figure 6. Tumor antigen-specific PD-1+ CD8+ TILs experience mitochondrial exhaustion.
CD8+ cells were sorted from spleens and tumors of mice bearing 14-day MCA-205-OVA tumors and qPCR was performed to quantify (A) PERK (Eif2ak3), ATF4 (Atf4), CHOP (Ddit3), and ERO1α (Ero1l) gene expression. Bar graphs represent averages of 4 mice per group and are shown as SEM, experiment repeated twice. Representative FACS plots and quantification of mtROS/PD-1+ CD8+ populations in tumor draining lymph nodes (TDLNs) and tumors (tumor infiltrating lymphocytes (TILs)) harvested from mice bearing 14-day (B) MCA-205-OVA sarcomas or (C) MC38 colon carcinomas. Populations represent gating from CD8+/CD45+ lymphocytes and quadrants are set from PD-1 isotype control expression. Bar graphs represent 4-5 mice per group and are shown as SEM. Individual experiments were repeated 3 times. (D) 1×10⁶ naïve CD45.2 OT-1+ T cells were transferred via tail vein to CD45.1 C57BL/6 mice bearing 7 day established s.c. MCA-205-OVA sarcomas. Tumors were harvested 7 days post transfer. (E) Representative FACS plot overlay and quantification of mtROS/PD-1 co-staining from CD45.1 (gray) or CD45.2 (black) CD8+ cells in TDLNs and tumors. Gates are set from isotype control data. Bar graphs represent 4 mice per group and are shown as SEM. Individual experiments repeated twice. Students t test, **p<0.01, ****p<0.0001.

