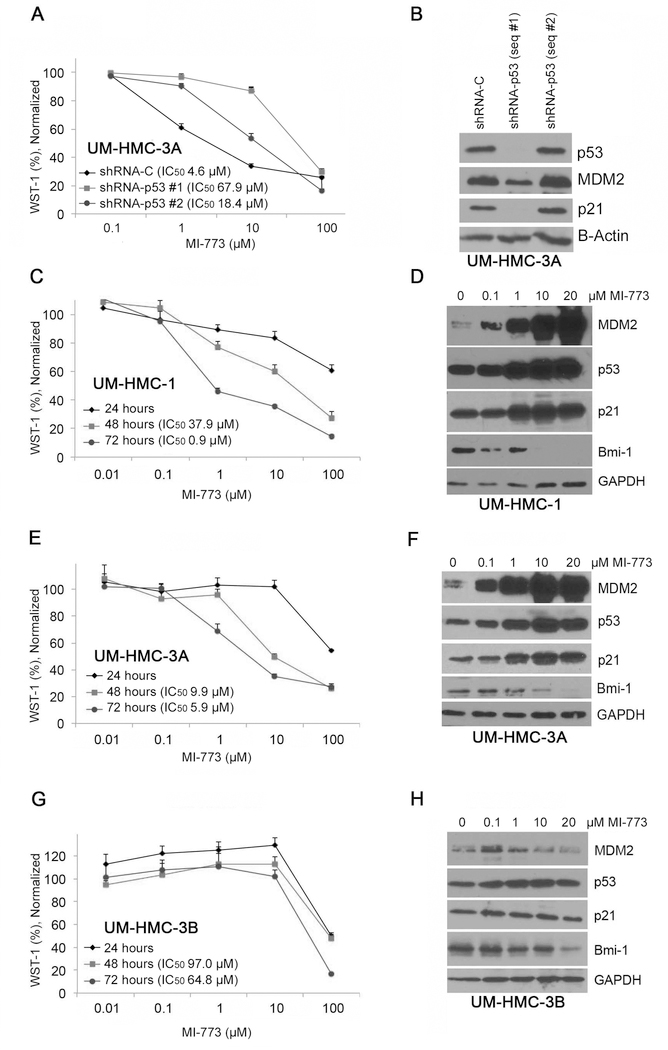
Figure 3.
Effect of MDM2/p53 binding inhibition by MI-773 on HMC cell number. A, WST-1 analysis of UM-HMC-3A sh-Control and shp53 cells. p53 was knocked down using three different lentiviral shp53 vectors. Transfected cells were plated at 500 cells per well and exposed to varying concentrations of MI-773 for 72 hours. After 4 hours of incubation with WST-1, the plates were analyzed and normalized to a DMSO control. B, Western blot analysis of lysates created from shp53 knockdown cells. C, WST-1 analysis of UM-HMC-1 cells treated with varying concentrations of MI-773 for 24, 28, and 72 hours. UM-HMC-1 cells were seated at 500 cells per well. After each time point, 10 µL of WST-1 reagent was added to the cells for 4 hours and then analyzed. All cells were normalized to a DMSO control. D, Western blot analysis of UM-HMC-1 cells treated with 0.1, 1, 10, or 20 µM MI-773 for 24 hours. E, WST-1 analysis of UM-HMC-3A cells treated with varying concentrations of MI-773 for 24, 28, and 72 hours. UM-HMC-3A cells were seated at 500 cells per well. After each time point, 10uL of WST-1 reagent was added to the cells for 4 hours and then analyzed. All cells were normalized to a DMSO control. F, Western blot analysis of UM-HMC-3A cells treated with 0.1, 1, 10, or 20 µM MI-773 for 24 hours. G, WST-1 analysis of UM-HMC-3B cells treated with varying concentrations of MI-773 for 24, 28, and 72 hours. UM-HMC-3B cells were seated at 500 cells per well. After each time point, 10uL of WST-1 reagent was added to the cells for 4 hours and then analyzed. All cells were normalized to a DMSO control. H, Western blot analysis of UM-HMC-3B cells treated with 0.1, 1, 10, or 20 µM MI-773 for 24 hours. Bars indicate the standard deviation.

