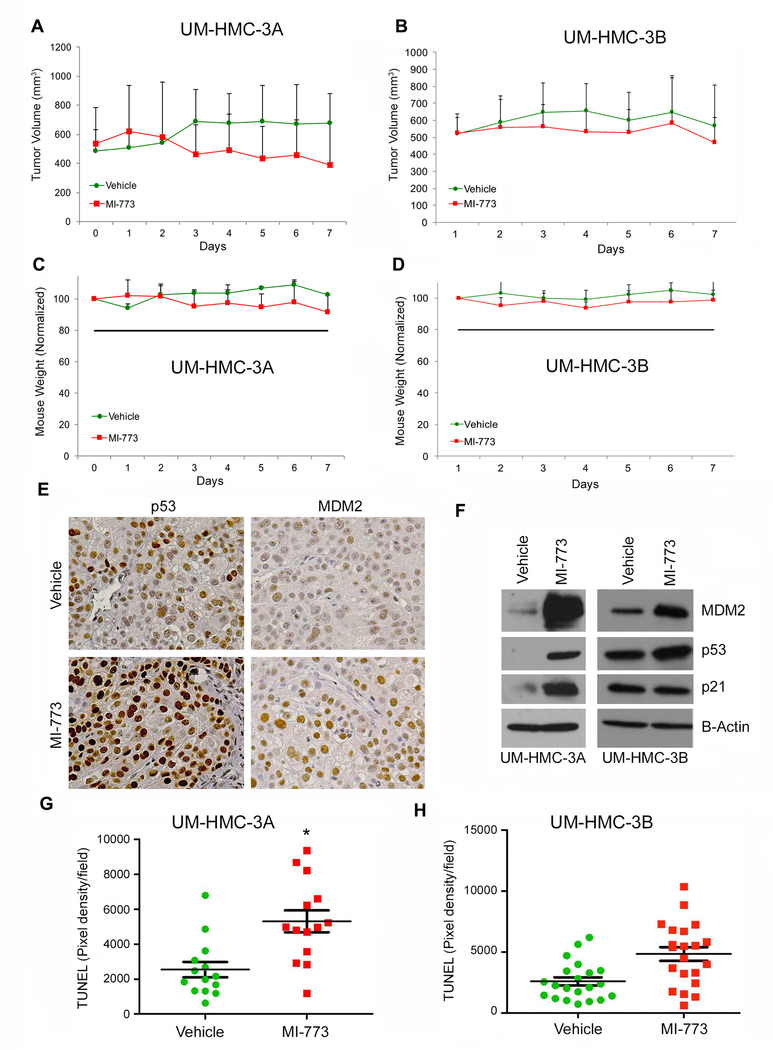
Figure 5.
Effect of MDM2/p53 binding inhibition by MI-773 on cancer stem cells in UM-HMC-3A cells in-vivo. A, Graph depicting the tumor volume during 6 days of 100 mg/kg treatment with MI-773. 600,000 UM-HMC-3A cells were co-implanted with 400,000 human endothelial cells (HDMEC) on biodegradable scaffolds in the subcutaneous space of SCID mice (N=4 tumors per experimental condition). Once tumor reached an average volume of 500 mm3, the mice were treated by daily oral gavage with 100 mg/kg MI-773 or a vehicle control. B, Graph depicting the tumor volume during 6 days of 100 mg/kg treatment with MI-773. 600,000 UM-HMC-3B cells were co-implanted with 400,000 human endothelial cells (HDMEC) on biodegradable scaffolds in the subcutaneous space of SCID mice (N=10 tumors per experimental condition). Once tumor reached an average volume of 500 mm3, the mice were treated by daily oral gavage with 100 mg/kg MI-773 or a vehicle control. C, Graph depicting the average mouse weight of UM-HMC-3A implanted mice during the 6-day treatment sequence. D, Graph depicting the average mouse weight in UM-HMC-3B implanted mice during the 6-day treatment sequence. E, Immunohistochemistry analysis of UM-HMC-3A MI-773 or vehicle treated tumors. Images were taken at 200X. F, Western blot analysis of tissue from vehicle and MI-773 UM-HMC-3A and UM-HMC-3B tumors. G,H, Graph depicting the pixel density per field of sections stained for TUNEL in UM-HMC-3A (G) or UM-HMC-3B (H) tumors in mice treated with MI-773 or vehicle control. Seven fields at 200X were taken per tumor section and quantified using the ImageJ software. Error bars indicated the standard error of the mean.

